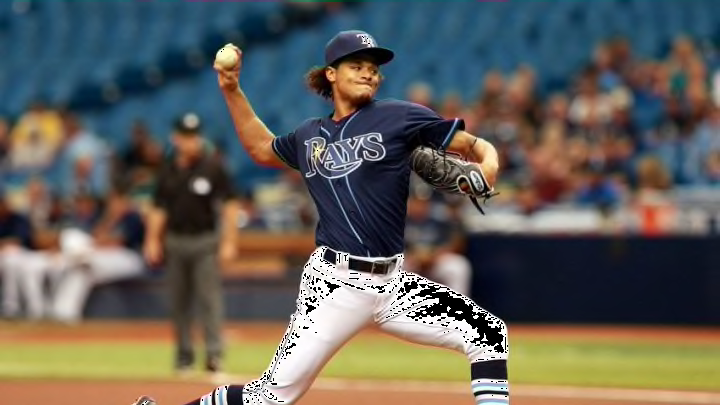
Chris Archer hasn’t looked anything like the ace he was a year ago for the Tampa Bay Rays. What is the main cause of his struggles?
In 2015, Tampa Bay Rays starter Chris Archer had something of a coming out party. He was still a productive pitcher in 2013 and 2014, but last season a few things fell into place that helped boost him into the category of elite starter. One of the biggest changes was a jump in his strikeout rate. In 2015 he struck out 10.7 hitters per nine which was second best in the AL behind Chris Sale.
This development in his ability to strike hitters out, along with improved command, led to a career year for Archer. He finished the season with a 3.23 ERA in 212 innings. Those numbers already look good, but a 2.90 FIP suggests he was even better than some of his numbers suggest. Archer was an easy All-Star selection, and he finished the season fifth in Cy Young voting. With how dominant he was in 2015, it was hard for fans not to be optimistic about what they would see in 2016.
More from Tampa Bay Rays
- A review of the St. Louis Cardinals trade that sent Randy Arozarena to the Tampa Bay Rays
- AL East: 1 screw up the Yankees, Red Sox, Orioles, Rays and Blue Jays can make at the MLB trade deadline
- Yankees, Red Sox, Blue Jays, Orioles, Rays: 1 July bold prediction for every AL East team
- Neander, Bendix and the 2023 Tampa Bay Rays: A mid-term grade
- MLB hot take: 5 disappointing players on contending teams
However, through three starts Archer’s production has looked very different from what he accomplished a year ago. He’s 0-3 with a 5.87 ERA, and he’s tied for the league lead in hits allowed with 22. Not only that, but he’s walking an additional two hitters per nine innings (4.7 BB/9). It’s clear that Archer hasn’t been the same pitcher thus far, so what has the primary problem been?
Obviously he’s only three starts into the season so the results are still an incredibly small sample. Yet, if you compare Archer’s 2015 to 2016 there is one obvious difference to note. Last season Archer’s slider was one of the best pitches in baseball. In conjunction with PitchF/X data, Fangraphs has a stat that measures the value of a particular pitch. In essence the stat is “an accounting method for attaching run values to each specific pitch rather than each specific plate appearance.” In 2015 Archer’s slider value was 25.4 wSL. This was the highest “runs above average” for any pitch by any pitcher in all of baseball last season.
That slider, which was such a devastating weapon a season ago, is producing very different results this season. The following chart makes clear that hitters are experiencing much better success against it.
Batting average and Slugging % against Archer’s slider:
| Batting Average | Slugging % | |
| 2015 | .189 | .272 |
| 2016 | .314 | .600 |
When you look at the available data (courtesy of Brooks Baseball) the issues don’t appear to be a loss of velocity or a change in usage. In 2016 Archer’s slider has averaged 86.9 mph, and in 2015 it came in at 87.8 mph. That’s a small change, but nothing to be too concerned about. This season he’s throwing his slider 39.5% of the time, and last year he used threw it 39.1%.
Although the issues don’t appear to stem from velocity or usage, but there are some worthwhile differences to note in terms of Archer’s command of his slider. In 2015, Archer left his slider in the zone only 36% of the time. As you would expect the majority of his sliders outside of the zone were located down and away to right handed hitters. The fact that he was able to repeatedly locate that dominant of a pitch in that location led to great results.
Chris Archer’s slider usage in 2015:

So far in 2016 he hasn’t had quite the same command of his slider. In those three starts, the slider has stayed in the zone 44% of the time, an 8% increase. However, he’s not only leaving his slider in the zone more often, but he’s missing in a location that he was largely able to avoid a season ago. Currently 14% of his sliders are staying up and in the strike zone. That number was only 6% a year ago. You can see the differences in the following chart.
Chris Archer’s slider usage in 2016:

Yes it’s a small sample size, but so far it appears that Archer’s primary problem has been controlling his slider. While it’s possible that hitters are simply more prepared for that pitch given the attention it received last season, it also appears that it’s currently a more “hittable” pitch.
Next: Top 100 Players in Baseball History (70-61)
Batters are having quite a bit of success if the slider stays in the zone and at least belt high. If Archer is able to get his command under control, then it’s likely he’ll look more like the pitcher that baseball fans watched in 2015. It’s definitely a story worth following as the season progresses.
