MLB: Is the Baseball Juiced?

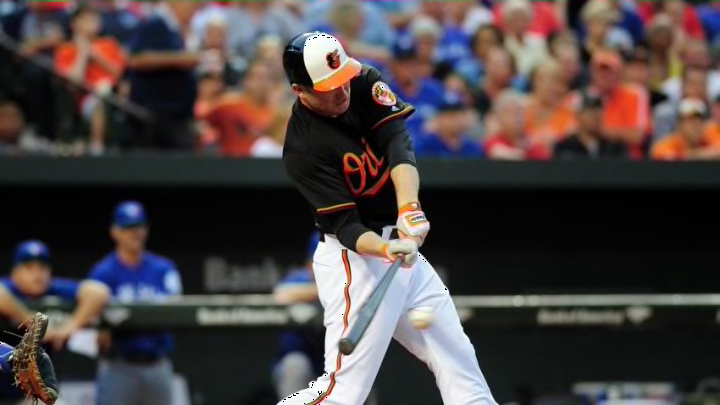
Jun 17, 2016; Baltimore, MD, USA; Baltimore Orioles outfielder Mark Trumbo (45) hits an RBI single in the third inning against the Toronto Blue Jays at Oriole Park at Camden Yards. Mandatory Credit: Evan Habeeb-USA TODAY Sports
1 of 5
Next
Jun 8, 2016; Minneapolis, MN, USA; Miami Marlins right fielder Giancarlo Stanton (27) hits a RBI single in the fifth inning against the Minnesota Twins at Target Field. Mandatory Credit: Jesse Johnson-USA TODAY Sports
Jun 8, 2016; Minneapolis, MN, USA; Miami Marlins right fielder Giancarlo Stanton (27) hits a RBI single in the fifth inning against the Minnesota Twins at Target Field. Mandatory Credit: Jesse Johnson-USA TODAY Sports /

The rate of home runs hit per balls in play in in the first half of this MLB season is the second-highest of all-time, with only the first half of the 2000 season being higher.

The only thing as ubiquitous as Pokemons these days are baseballs flying out of Major League ballparks. Going back to 1920, the start of the lively ball era, only the first half of the 2000 season has seen more balls in play land for home runs than the first half of the 2016 season. I thought something strange was happening this year, so I went to the record book. I found the rate of home runs per balls in play for the first half of each MLB season going back to 1920. I’m using the first half of each season to compare apples to apples, since we’re not yet through the entire 2016 season. I’m also using the rate of home runs per balls in play because I feel that’s the best metric to isolate the rate at which home runs are being hit. Home runs per balls in play is simple. It excludes walks, strikeouts, HBP, and sacrifice bunts, but not sacrifice flies. If a ball is put into play, it counts.

This season’s first half rate of HR/BIP is 4.4% and has only been bested once since 1920. The one season with a higher rate is the first half of the 2000 season, when the HR/BIP rate was 4.5%. In fact, there have only been three seasons since 1920 in which the rate of HR/BIP was as high as 4% in the first half—1999, 2000, and 2001. Those three seasons came during a stretch of high offense seasons that saw runs per game jump to levels not seen since the depression-era 1930s.

The history of HR/BIP in MLB is an interesting one. Before the advent of the lively ball in the early 20s, MLB hitters saw roughly 0.5% of their balls in play go for home runs. The introduction of a livelier ball pushed that number up over 1.0% very quickly, and it further increased up to around 2.0% in the mid 1930s.

/

During World War II, many MLB players served in the military. Also, the U.S. banned the use of rubber for non war-related goods, including for baseballs. In 1943, MLB used rubberlike shells made of balata instead of real rubber and the rate of HR/BIP dropped precipitously, to 1.1%. It increased as players returned to MLB after serving in the military and the ball was restored to its previous composition. By 1947, HR/BIP was back up to pre-war levels.

The first half of the 1955 season was the first time the HR/BIP rose over 3.0% and it generally stayed at or near that level through the rest of the 50s and most of the 60s. Then, suddenly, offense plummeted in 1968, as did the first half rate of HR/BIP (2.3%, the lowest level since 1949). The powers that be in Major League Baseball lowered the mound and reinstated the 1961 strike zone and the HR/BIP rate jumped up to 2.9% in 1969.

Baseball in the 1970s and 1980s generally had first half HR/BIP rates between 2.5% and 3.0%, except for the bizarre 1987 season, when it shot up to 3.9%. That “blip” lasted just that one season. The very next year, the first half HR/BIP rate dropped to 2.7%. The next big jump came in the 1990s. The rate rose from 2.6% in 1992 to 3.0% in 1993 to 3.6% in 1994. This was the advent of a new home run hitting era in baseball that peaked in 1999 (4.0%), 2000 (4.5%), and 2001 (4.1%). Many people blame PED use for the high-offense era from 1994 to the early 2000s. It’s possible that PED was the driving factor, but the composition of the ball could have played a role as well.

Next: Outlier Seasons
/

The increase in first half HR/BIP from 2015 to 2016 is striking. In 2015, hitters produced a 3.6% HR/BIP in the first half, which is right in line with baseball seasons going back to 2002. If you order the 14 seasons from 2002 to 2015 by lowest first half HR/BIP rate, the 2015th would rank 6th. The jump from 2015’s 3.6% to 2016’s 4.4% is nearly unprecedented. In fact, it is the second-greatest season-to-season increase in MLB history. The top five seasons with the greatest first half increase in HR/BIP from the previous year are 1977, 2016, 1987, 1969, and 1994. Let’s take a look at those seasons more in-depth.

The 1977 season was an expansion year that saw MLB add two franchises—the Seattle Mariners and the Toronto Blue Jays. Not only did MLB introduce two new ballparks and two additional rosters of pitchers, it was also the year they switched from balls produced by Spalding to a new version made by Rawlings. The first half HR/BIP rate increased from 2.1% in 1976 to 3.0% in 1977, which is the largest season-to-season increase in baseball history. The next year, the rate fell to 2.5%. It looks like a one-year increase that could be attributed to the new ball manufacturer. Expansion may have played a role, but the previous expansions in 1961 (+0.3%), 1962 (-0.1%) and 1969 (+0.7%) did not yield such a large increase in first half HR/BIP. Also, the increase in 1969 had other contributing factors such as the lowered mound and a different strike zone.

The 1987 season was a major outlier in the 1980s. Every season in the 80s had a first half HR/BIP between 2.2% and 2.7%, except 1986 and 1987. In 1986, the rate jumped to 3.2%, then shot up to3.9% in 1987, before returning to 2.7% in 1988. As has been written elsewhere, there is plenty of suspicion that the ball was more lively in 1987. Wade Boggs hit 24 home runs in 1987 and never hit more than 11 in any other season. Andrew Dawson hit 49 bombs in 1987. The most he’d hit before that was 32 and the most he would hit after was 31. George Bell hit 47 dingers. His second-most in a season was 31.

Embed from Getty Images

The sheer increase in the number of players hitting 30 home runs also makes the 1987 season look suspicious. Twenty-eight players hit 30 or more home runs in 1987, including Wally Joyner (34, second-most in his career was 22), Brook Jacoby (32, second-most was 20), and Larry Sheets (31, second-most was 18). There were 13 players with 30 or more home runs in both 1985 and 1986. That number jumped to 28 in 1987 and, suddenly, back down to five in 1988.

During the 1987 season, there was plenty of talk about the home runs that were being hit. Sparky Anderson, Pete Rose, Jack Morris, and Bert Blyleven were among the people in baseball who thought something suspicious was going on with the ball. Of course, MLB disregarded talk about any changes to the ball.

The fourth-largest increase from one season to the next in first half HR/BIP was 1969. This came just after the “year of the pitcher” when run scoring bottomed out at 3.4 runs/game. Bob Gibson had an ERA of 1.12 and Carl Yastrzemski led the AL in hitting with a .301 batting average. Batting Average on Balls In Play (BABIP) was .264, the lowest in baseball history (even lower then in 1943, when the balata ball was in use). In addition to adding four expansion teams, Major League Baseball made two significant changes before the 1969 season. The mound was lowered from 15 inches to 10 and the rulebook strike zone was returned to the size it had been in 1961. With those changes, the first half HR/BIP rate jumped from 2.3% in 1968 to 2.9% in 1969.

Embed from Getty Images

Finally, the fifth-largest jump came in 1994. After the aberrant 1987 season (3.9% first half HR/BIP), home run rates returned to their previous levels. From 1988 to 1992, the first half HR/BIP rate was between 2.4% and 2.9% each year. This rate jumped from 2.6% in 1992 to 3.0% in 1993, then increased again to 3.6% in 1994.

One explanation that has been used to explain this increase in home runs is expansion. Two new franchises began play in 1993—the Colorado Rockies and Florida Marlins and the Rockies were playing in Mile High Stadium, which was a terrific hitter’s park. But did expansion cause this increase in home run rate? This article from the Hardball Times says no. Using a method that incorporated matching pairs of hitters and pitchers to eliminate the expansion effect, the linked article suggests that expansion was not the reason for the increase and suggests the composition of the baseball was a likely factor.

Embed from Getty Images

The other possibility is PED use. This was the beginning of a high-offense era that has often been called “the Steroid Era.” There was a significant increase in offense from 1992 to 1994. Along with the increase in first half HR/BIP shown above (2.6% to 3.0% to 3.6%), run scoring jumped from 4.1 R/G to 4.6 R/G to 4.9 R/G. If PED use was the driving factor, it would suggest that PED use increased quickly throughout baseball over a two year period from 1992 to 1994. I think it’s possible that both the composition of the ball and PED use were factors.

So, for the five years with the greatest season-to-season increase in first half HR/BIP, we know that the ball manufacturer was changed in 1977 and there’s a strong likelihood that something was changed with the ball in 1987 and possibly sometime between 1992 and 1994 (with PED use as a contributing factor). The 1969 season saw changes in the strike zone and the height of the mound. That leaves this season, 2016, during which we’ve seen the second-largest first half HR/BIP increase from the previous year and a season in which the first half HR/BIP is the second-highest in the history of baseball. Is the ball juiced this year?

Next: Eliminating Other Factors

/

In considering why baseballs are suddenly flying out of the park at a rate nearly unmatched in baseball history, I believe we can eliminate PED use. For one thing, there is much stronger testing now. There was no testing for PED use prior to 2003, so PED use is more likely to have been a factor in the jump in HR/BIP from 1992 to 1994. With today’s testing policy, it is much less likely to be a factor.

A more important reason, in my opinion, that PED use can be eliminated as a factor is that the jump has happened so quickly. In fact, it isn’t just the first half of this season. This goes back to the second half of 2015. Here are the monthly HR/BIP rates for 2015 and how those months rank historically:

3.4%–April (21st-highest April rate ever)

3.7%–May (11th-highest May rate ever)

3.6%–June (20th-highest June rate ever)

3.7%–July (17th-highest July rate ever)

4.1%–August (3rd-highest August rate ever)

4.2%–September (highest September rate ever)

Here are the monthly HR/BIP rates for 2016:

4.0%–April (5th-highest April rate ever)

4.3%–May (2nd-highest May rate ever)

4.7%–June (highest June rate ever)

4.7%–July (highest July rate ever)

This jump in home runs began last summer and it happened quickly. After four months in which the home run rates were well within the standards of the previous decade, there was a sudden and significant increase in August and September. Over the last six months of baseball going back to August of 2015, we’ve seen three months with the highest HR/BIP rates ever, one month with the second-highest, another with the third-highest, and one with the fifth-highest. It would be ludicrous to think that PED use was responsible because we would have to believe that a significant number of players suddenly found a way to beat PED testing. I just don’t think it’s a plausible explanation.

Next: What Does MLB Say?

Mandatory Credit: Denny Medley-USA TODAY Sports
Mandatory Credit: Denny Medley-USA TODAY Sports /

Whenever there are whispers about a livelier ball, MLB is quick to disregard the baseball as a factor. There’s never been an explanation for the sudden rise and just as sudden fall in home runs in 1987. The increase from 1992 to 1993 to 1994 has been attributed to PED use, even though there’s some evidence that the ball could have played a role. The recent sudden increase in home runs was addressed by MLB commissioner Rob Manfred at the All-Star Game and he dismissed PED use and juiced baseballs as factors.

As reported by Jerry Crasnick at ESPN, commissioner Manfred said, “The increase in the number of home runs takes place against a different backdrop. Major League Baseball does 22,000 drug tests a year. The World Anti-Doping Agency says we have one of the best testing programs in the world, let alone in professional sports. Our investigative capacity in the area of performance-enhancing drugs is probably the best in the world. So I’m much less concerned that this is due to [PEDs]. We think it has to do with the way pitchers pitch and the way hitters are being taught to play the game. You’ve seen some unusual developments in terms of home run hitters being up in the lineup to get them more at-bats.”

Oct 21, 2015; Toronto, Ontario, CAN; Toronto Blue Jays third baseman
Oct 21, 2015; Toronto, Ontario, CAN; Toronto Blue Jays third baseman /

He also dismissed the theory that changes in the baseball could be the culprit, claiming that MLB has done extensive testing on the baseballs and found no changes. Of course, the next time a commissioner of baseball admits to juicing up the baseball will be the first, so Manfred’s denial must be taken with a grain of salt.

Let’s look closer at what Manfred said about pitchers and hitters. “We think it has to do with the way pitchers pitch and the way hitters are being taught to play the game.” It sounds like he is suggesting that hitters are now swinging for the fences and intentionally trying to hit home runs and are more successful with that approach than they were before. To that, I would ask, why didn’t they think of this sooner? Did hitters suddenly figure out how to hit more home runs?

Somehow, this seems unlikely. If hitters have changed their approach to hit more home runs, wouldn’t we expect more fly balls to be a result of that change in approach? Instead, we find that fly ball percentage (FB%) in 2015 was the lowest we’ve seen since 2002 (which is as far back as batted ball data goes, per Fangraphs). The 2016 season has the third-lowest FB% since 2002. Hitters are not hitting more fly balls. They aren’t hitting more line drives either. They ARE hitting more ground balls. The highest ground ball percentage (GB%) since 2002 came last year. This season’s GB% is the third-highest since 2002.

Think about this. Manfred is suggesting that hitters have changed their approach and this has resulted in more home runs being hit. It would be logical to think that a hitter trying to hit a home run would want to put the ball in the air. The numbers show that hitters have hit fly balls less often over the last two years than in all but one season since 2002 and have hit ground balls more often over the last two years than in all but one season since 2002. I believe this is enough to reject Manfred’s assertion about a change in approach.

May 9, 2016; Arlington, TX, USA; Chicago White Sox third baseman
May 9, 2016; Arlington, TX, USA; Chicago White Sox third baseman /

There is one batted ball statistic that matches with the increasing number of home runs being hit and that is home runs per fly ball percentage (HR/FB). The yearly HR/FB rate from 2010 to 2014 was 9.4%, 9.7%, 11.3%, 10.5%, and 9.5%. Then came 2015. Let’s look at the monthly HR/FB rate for last year:

10.2%–April ‘15

11.3%–May ‘15

10.6%–June ‘15

11.1%–July ‘15

12.2%–August ‘15

12.3%–September ‘15

And we’ll continue this into the 2016 season:

11.8%–April ‘16

12.8%–May ‘16

13.7%–June ‘16

13.9%–July ’16 (through July 10)

Again, something happened last August that has continued through July of this year. Even though fewer fly balls were being hit, more of those fly balls were flying out of the yard. For the time period in which we have batted ball data, the two seasons with the highest HR/FB rate are 2015 (11.4%) and 2016 (12.9%). I think this is further evidence that the ball could be the culprit.

Next: The Bottom Line

Mandatory Credit: Joe Nicholson-USA TODAY Sports
Mandatory Credit: Joe Nicholson-USA TODAY Sports /

Without unbiased testing of the baseball, we don’t know if the ball is livelier this year than it’s been in the recent past. Major League Baseball insists that there has been no change. As reported in the New York Times, Mike Teevan, a spokesman for MLB, said the league does “extensive reviews of the performance of the baseball, and there have been no differences” that would explain the increase in homers.

Commissioner Manfred’s suggestions of a change in approach by hitters seems unlikely. Hitters are hitting more home runs even though they are hitting fewer fly balls. A greater percentage of fly balls are leaving the yard which, to me, suggests that balls are flying farther.

We do know that something changed significantly in August of 2015 that resulted in a large increase in home runs per balls in play. This has continued into this season, with June and July producing the highest monthly rates of HR/BIP ever and May producing the eighth-highest rate in history.

Next: Stanton in for a Big Second Half?

When hitters are making contact, they are hitting home runs at an unprecedented rate. I don’t believe PEDs are to blame and I can’t say with 100% certainty that changes to the ball are to blame, but I think that’s the most likely explanation.

Next