MLB: Five Teams Outperforming Run Differentials


At the All-Star Break, here is a look at five MLB teams that are outperforming their run differentials, a key indicator on how their second half could go.
A simple view at the standings at this point in the season will tell you that the San Francisco Giants, Chicago Cubs and Washington Nationals have been good. Those three teams own the best records in MLB.
In that view, it’s also easy to see that Atlanta Braves, Cincinnati Reds and Minnesota Twins are competing for the number-one draft pick, as those three teams own the worst records in MLB.
However, with still just under half a season left, a team’s record is not the best measurement of what a team may do in the future. Often times, a team outplays its talent and could be a prime candidate for regression in the second half.
Run differential is a tool that is used to determine how many runs a team scores and how many they give up. Two teams could both hold equal 47-41 records; however, the team outscoring its opponents by 20 runs is likely better than the team outscoring its opponents by one run.
Using Fangraphs, we use “Pythagorean Record” and “Base Runs” to calculate if a team is outperforming or under-performing its run differential. You can find this data on the Fangraphs Projected Standings page.
Before we delve into the post, here is a look at an explanation for each statistic we will be looking at.
Pythagorean
You may not know Pythagorean Record by that name, but you’ve likely heard about run differential. Run differential allows you to calculate a team’s Pythagorean Record. The idea here is that how many runs a team scores and allows is a better reflection of their ability and performance than their W/L record.
Base Runs
Base Runs helps here because it takes into account a team’s performance without considering the sequencing to calculated expected runs scored and runs allowed, and then takes those numbers to generate expected wins and expected losses. There are a lot of ways to get to 4-1 in the standings, but the team’s expected run differential is going to be a better predictor of future success than that 4-1 record going forward.
Let’s take a look at teams that have outperformed their run differentials in the first half of the season. These are the teams we could see regress to their true talent level in the second half, which could potentially lead some of the teams on the list out of a playoff spot, in a highly competitive season.
Next: Number 5

5. Baltimore Orioles
2016 Record: 51-36
Run Differential: +41
2016 PythagenPat: 48-39
+/-: +3
2016 BaseRuns: 47-40
+/-: +4
At the All-Star break, the Baltimore Orioles lead the American League East by two games over the Boston Red Sox and Toronto Blue Jays. Something that was not all that expected after an offseason of heavy criticism levied their way.
The Orioles have very slightly outperformed their record, which could mean the difference between winning the division and potentially sitting out the playoffs in a highly competitive division and Wild Card race over in the AL.
Led by their high-powered offense, the Orioles lead the American League in home runs and rank fourth in fWAR. The Orioles also hit for the third best average in the league, which all combined, makes their offense a force, as their wRC+ ranks second behind the Boston Red Sox.
On the pitching side, the Orioles hold their own with a middle-of-the-pack pitching staff that ranks seventh in fWAR in the league.
The Orioles’ ERA is middle-of-the-pack in the American League, but the team’s FIP of 4.47 is the fifth worst in the American League. That is the main weakness the team needs to address at the trade deadline.
Unfortunately for the Orioles, Ubaldo Jimenez owns a eyesore 7.38 ERA and a 4.91 FIP in 81.2 innings of work in 2016. The Orioles need to either get better production from Jimenez or they need to move on pretty quickly in the second half.
Next: Number 4

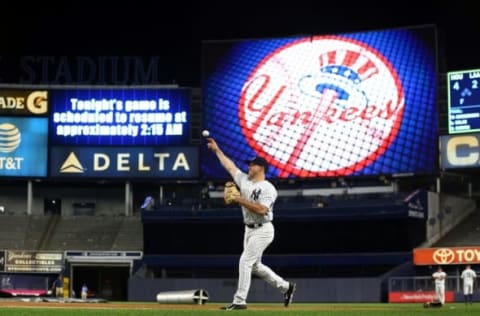
4. New York Yankees
2016 Record: 44-44
Run Differential: -34
2016 PythagenPat: 40-48
+/-: +4
2016 BaseRuns: 40-48
+/-: +4
The New York Yankees are reportedly weighting whether they should become sellers at the trade deadline. While they sport a .500 record and a not-so-insurmountable 5.5 game deficit in the AL Wild Card race, the Yankees should definitely look to be sellers.
Despite owning the second best pitching staff in the American League according to fWAR, the Yankees have not been able to muster enough offense to become a viable threat to the Boston Red Sox and Baltimore Orioles this year.
In 2016, the Yankees’ fWAR ranks as the third worst offensive team in baseball. The team’s collective 88 wRC+ is tied with the Oakland Athletics for the second worst mark in the American League.
Outside of Masahiro Tanaka, the Yankees should make all of their pitching available for trade.
The San Diego Padres netted a potential mid-rotation arm in Chris Paddack for the services of Fernando Rodney. The Yankees should ask for a king’s ransom on their relievers, Aroldis Chapman, Andrew Miller and Dellin Betances.
If the Yankees did move on from one of those three relievers, they have a potential late-innings option in struggling starter Nathan Eovaldi, who was recently demoted to the bullpen. His high-heat fastball would probably work better out of the pen than it has in the Yankees rotation this season.
With the type of money the Yankees can throw around, moving some of their expendable parts for major league ready prospects could help the franchise return to prominence pretty quickly, if they can make the right moves.
Selling at the trade deadline is looked down upon for a proud Yankees franchise, but it is likely what’s best for their future, as their record and run differential both suggest this team is an unlikely playoff team in 2016.
Next: Number 3

3. San Francisco Giants
2016 Record: 57-33
Run Differential: +73
2016 PythagenPat: 53-37
+/-: +4
2016 BaseRuns: 51-39
+/-: +6
Los Angeles Dodgers fans will enjoy this segment of the post, as we call one of their chief rivals slightly overrated, even if that team holds the best record in baseball at the All-Star break.
It is an even-numbered year and that means it is time for the San Francisco Giants to claim their bi-annual World Series rings, as they have in 2010, 2012 and 2014. So it is only fitting that they closed the first half with a 6.5 game lead over the second place Los Angeles Dodgers in the NL West.
Despite having the second fewest home runs in the National League, the Giants own the third best wRC+ of 104 in the league. The Giants are aided by the third best base-on-ball percentage, which leads to the third highest on-base percentage in the league.
Beyond that, the Giants also catch the ball well, as Fangraphs rates their defense as tied as the best in the National League, along with the Chicago Cubs.
The Giants also rate as the fifth best pitching staff in the NL, based on their fWAR. Their starters rank third and their bullpen ranks sixth in the National League.
Two “weaknesses” for the Giants to potentially address as the trade deadline nears includes adding some power to an already impressive offense and shoring up their bullpen with an arm to help with some of the struggles they’ve had there.
Due to the strength of their rotation, the Giants bullpen has been the second least used in the National League, behind only the St. Louis Cardinals.
Despite the team outperforming its run differential, regression should not be a major concern for the Giants. With a six and a half game lead and plenty of resources to add to their team, the Giants are well on their way to defending their even-year World Series streak.
Next: Number 2

2. Philadelphia Phillies
2016 Record: 42-48
Run Differential: -87
2016 PythagenPat: 35-55
+/-: +7
2016 BaseRuns: 36-54
+/-: +6
The Philadelphia Phillies have been an enigma in the 2016 MLB season. The team got off to a hot start that no one anticipated. The team went 14-10 in the month of April, and a 12-16 record in May brought the team back to .500.
They followed that .500 record in the first two months with a 9-19 mark in the month of June, before bouncing back with a 7-3 record so far this month. This month has seen the Phillies outscore opponents by eight runs in 10 games so far, which is right in line with their team record for the month.
However, for the season, the Phillies have been outscored by 87 runs, indicating their 42-48 record has actually been kind to them.
A 36-win mark would push the team closer to the 22.5-game deficit the Atlanta Braves hold with a 31-58 record than the 12-game deficit they face currently in the National League East.
While the Phillies have the second worst fWAR in all the National League, their pitching has been a pleasant surprise, ranking seventh in the NL.
The Phillies’ 80 wRC+ ranks ahead of only the Atlanta Braves and Cincinnati Reds in the National League. The Phillies hit for little power, own a team .296 on-base percentage and they rate poorly as a team in base running.
However, the team defends well and as mentioned above, pitch well, which is a good sign for a young team pitching in what is generally known as a hitter’s home ball park.
With a staff led by Aaron Nola and Vincent Velasquez, the Phillies do have a bright future, if they can ignite their offense over the next few years.
Next: Number 1

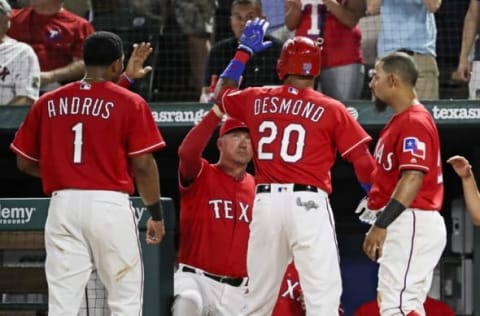
1. Texas Rangers
2016 Record: 54-36
Run Differential: +16
2016 PythagenPat: 47-43
+/-: +7
2016 BaseRuns: 43-47
+/-: +11
The Texas Rangers are off to a surprising start in 2016, leading the American League West over the Houston Astros by five and a half games at the All-Star break. The Rangers’ 54 wins leads the entire American League in the first half.
However, while their record indicates the team has been excellent, the underlying numbers insist that the Rangers are closer to an average team, and not an elite one.
More from Call to the Pen
- Philadelphia Phillies, ready for a stretch run, bomb St. Louis Cardinals
- Philadelphia Phillies: The 4 players on the franchise’s Mount Rushmore
- Boston Red Sox fans should be upset over Mookie Betts’ comment
- Analyzing the Boston Red Sox trade for Dave Henderson and Spike Owen
- 2023 MLB postseason likely to have a strange look without Yankees, Red Sox, Cardinals
While the Rangers have scored the third most runs in the American League, their team wRC+ of 94 ranks 11th in the league. While the team strikes out among the least often in the AL, they walk the third least, which does not combine well with the fact they have middle-of-the-pack power.
On the pitching side, the Rangers have the second lowest total fWAR in pitching, with a 3.8 fWAR that ranks above only the lowly Los Angeles Angels. While the 4.44 ERA is middle-of-the-pack, the Rangers’ 4.89 FIP is the worst among American League teams.
No team in the AL strikes out fewer hitters per nine innings (6.55) than the Rangers.
Obviously a quick fix for that would be to trade for a starting pitcher. The Rangers have the prospect resources to trade for a Sonny Gray or a Chris Archer if either became available. They could also target a Rich Hill or a Drew Pomeranz to bolster their rotation as well.
Next: Cleveland eyeing Yankees relievers?
While the underlying numbers indicate that the Rangers are a weaker team than the standings show, the important thing for the Rangers is that those wins are in the books, no matter what.
Now the Rangers need to take advantage of that hot start and bolster their team for the stretch run.