MLB rookies are mimicking the historic class of 2015

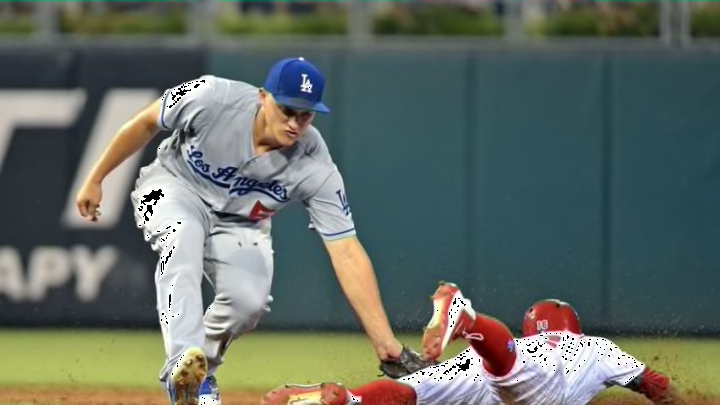
Aug 16, 2016; Philadelphia, PA, USA; Los Angeles Dodgers shortstop Corey Seager (5) tags out Philadelphia Phillies second baseman Cesar Hernandez (16) who was trying to steal second base during the third inning at Citizens Bank Park. Mandatory Credit: Eric Hartline-USA TODAY Sports
5 of 5
Next
Mandatory Credit: Gary A. Vasquez-USA TODAY Sports
Mandatory Credit: Gary A. Vasquez-USA TODAY Sports /

The 2016 MLB rookie class has players mimicking players from the historically good 2015 class.

Los Angeles Dodgers youngsters Corey Seager and Joc Pederson have similar beginnings to their MLB careers. Pederson was a September promotion in 2014, earned the starting job in center field the next Spring Training and competed for the National League Rookie of the Year. Seager debuted last September, earned the starting shortstop role this spring and will probably win the NL ROY.

Both players are examples of the youth movement that is sweeping baseball, and with so many young players, it’s easy to spot familiar narratives to a rookie season. One of last season’s story lines was the rookie class’ legitimate claim as the best ever. This season Seager’s rookie production is bordering on historic – more on that later. Other rookies have also chased history this season. Some rookies, such as Pederson, start out hot but fizzle as the weather got hotter.

These are all narratives that are familiar to baseball fans. They’ve happened to rookies before and they’ll happen again. So how does this rookie class compare to last year’s baby boom?

The position players of the 2015 rookie class amassed 84.6 wins above replacement according to FanGraphs, while the pitchers totaled 49.1. Sixteen position players and eight pitchers had 2.0 WAR or more. Of those above 2.0 WAR, Kris Bryant (6.5), Matt Duffy (4.9), Francisco Lindor (4.6) and Anthony DeSclafani (3.2, most for pitchers) were at the high end while Miguel Sano, Jake Lamb and Ken Giles all barely made the threshold.

This season’s rookie position players don’t even come close. Entering play Wednesday position players totaled just 17.7 WAR and had a .297 weighted on-base average – the 2015 class had a .303 wOBA. While Seager (5.8) may end up with more WAR than Bryant, no other position player is yet above 3.0. Their total WAR will be middle of the pack historically.

The pitchers are holding their own. They have 40.7 WAR with eight pitchers above the 2.0 threshold; Steven Matz (2.8) and Michael Fulmer (2.6) lead the pack. Depending on the innings limit the Detroit Tigers put on Fulmer, this group may be better than 2015’s.

Now that we’ve established the overall comparison between the two rookie classes, let’s have a look at some specific case studies. (All stats entering Wednesday.)

Next: Pederson and Mazara

Mandatory Credit: Tim Heitman-USA TODAY Sports
Mandatory Credit: Tim Heitman-USA TODAY Sports /

Texas Rangers outfielder Nomar Mazara made an immediate impact for the Texas Rangers. He homered in his first game and through June 11 had a .367 wOBA. Then he started to have his rookie struggles: from June 12 to the beginning of the MLB All-Star break, he slashed an anemic .196/.240/.268 with one home run.

It looked a lot like what Pederson went through in 2015. Pederson was one of the hottest sluggers over the first two months of the season, slashing .267/.393/.606 with 17 HR through June 3. What followed was a slow and painful leakage in his production: he slashed .177/.319/.303 with nine home runs the rest of the year. By the All-Star break he had been passed by Bryant in the NL ROY race.

While the two players’ struggles were similar, the reasons they happened were different. Pederson started swinging and missing more than he already was, which kept him from taking advantage of his power – it looks like he has corrected that problem. Mazara’s problems came from bad luck, as his batting average on balls in play fell to .217 during the slump. His luck has since turned as he’s slashed .284/.357/.420 since the break.

Next: Bringing the heat

Mandatory Credit: Charles LeClaire-USA TODAY Sports
Mandatory Credit: Charles LeClaire-USA TODAY Sports /

Cincinnati Reds pitcher Anthony DeSclafani may have had the most WAR among rookie pitchers last season, but there is no question Noah Syndergaard was the brightest star. His 5.35 strikeout-to-walk ratio was the highest for a rookie in MLB’s modern era (since 1900) and his walks and hits per innings pitched (1.05) was 18th. Now he is a CY Young candidate.

The Pittsburgh Pirates’ Jameson Taillon nearly lost his top-100 prospect label after missing nearly two years to injuries, but that hasn’t stopped him from posting a Syndergaardian 5.78 K/BB, 3.00 earned run average and 3.39 fielding independent pitching – Syndergaard had a 3.24 ERA and 3.25 FIP last season. Hitters have a .289 BABIP against Taillon this season and hit .282 against Syndergaard.

The similarities are even more striking when considering their repertoires. Check out this table of pitch usage (average velocities in parenthesis):

4s Fastball

Sinker

Changeup

Curveball

Syndergaard ‘15

37.98% (97.69) 23.74% (97.67) 14.21% (88.81)

22.01 (81.20)

Taillon ‘16 29.57% (95.06) 33.06% (94.89) 10.68% (87.61)

26.59% (80.78)

Those numbers come from Brooks Baseball. Taillon relies on his sinker more than Syndergaard does – resulting in a groundball rate almost eight points higher – while Syndergaard throws with more velocity and strikes batters out at a higher rate. But in general the magazines carry the same bullets.

Syndergaard dropped his curveball usage this season in favor of his slider. As a result, his groundball rate (50.3 percent of batted balls) is now closer to Taillon’s (53.8).

Next: Rookie shortstop tandems

Mandatory Credit: Noah K. Murray-USA TODAY Sports
Mandatory Credit: Noah K. Murray-USA TODAY Sports /

Colorado Rockies shortstop Trevor Story came out hot with seven home runs in his first six games, and other than a .303 wOBA from May 10 to May 31, he was consistently good. He had an OPS of .760 or better in every month this season and had a .992 OPS in July before a thumb injury sidelined him for the rest of the season. He finished the year with a .272/.341/.567 line with 27 home runs (.380 wOBA) and 2.6 WAR.

Corey Seager is vying for MVP consideration. His 5.8 WAR is more than double the next closest rookie (Matz at 2.8) and sixth overall. There is a good chance he’ll have one of the top 15 rookie season’s ever. He, along with Correa and Lindor, are the poster boys for the next renaissance of young shortstops.

But were Seager and Story better than last season’s tandem of Carlos Correa and Lindor? Offensively, Seager (.374) and Story each have a higher wOBA than the 2015 tandem – .365 for Correa and .358 for Lindor. Seager, to a lesser extent than Lindor, is one of the best defensive shortstops in the game while Correa and Story mingle closer to average.

Both Correa and Lindor played 99 games last season and had 3.3 and 4.6 WAR, respectively. (As a reference, Story played in 97 games this season.) Barring injury Seager will play a full season, but neither Correa nor Lindor made his debut until June. Both Correa and Lindor would’ve put up even bigger numbers than they did if they had been given a full season – numbers that probably would’ve looked a lot like Seager’s.

Next: Power hitters

Mandatory Credit: Adam Hunger-USA TODAY Sports
Mandatory Credit: Adam Hunger-USA TODAY Sports /

Yes, that is correct, Aaron Judge and his teammate Tyler Austin had the best welcome party in MLB history.

Judge is the more heralded prospect and he’s been ridiculously hot since being called to the majors, so we’ll focus on him. Judge is a mountain of a man who hits the ball really hard and really far. He hit 19 home runs in Triple-A this season before his MLB promotion.

He reminds baseball fans of a mountain-sized man who hits balls really hard and really far. The Minnesota Twins’ Miguel Sano put on quite a power display in his rookie season in 2015, hitting 18 home runs and slugging .530 in 80 games. He was promoted straight from Double-A, where he was slugging .544 with 15 home runs.

These two hitters are almost clones. Check out their batted ball and plate discipline profiles from prior to their promotions: (Figures are from StatCorner and FanGraphs.)

Fly Ball %

Line Drive %

Strikeout Rate

Walk Rate

BABIP

Isolated Power

Sano, AA

33.7 25.3 23.8 13.3 0.315

0.274

Judge AAA 32.8 24.6 23.9 11.5 0.319

0.219

That’s not all. Over the course of his minor league career, Sano slashed .278/.372/.563 with a 26.0 K% and 12.1 BB%; Judge slashed .279/.373/.471 with a 24.3 K% and 12.4 BB%.

Next: The underrated Charlie Blackmon

That’s crazy similar production, but the one difference is that Sano hit for a bit more power. Sano homered once every 18 plate appearances while Judge homered every 27. Working in Sano’s favor is that he has been playing professional baseball since 2010 and had almost 300 more plate appearances under his belt, while Judge wasn’t drafted until 2013.
Next