Cy Young Award 2017: The BBWAA is getting smarter

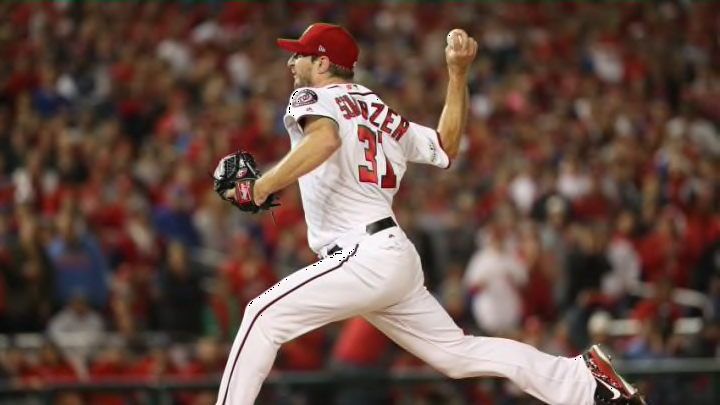
WASHINGTON, DC - OCTOBER 12: Max Scherzer
2 of 4
Next
WASHINGTON, DC – OCTOBER 12: Max Scherzer
WASHINGTON, DC – OCTOBER 12: Max Scherzer /

Cy Young Award 2017. The BBWAA voters have greatly improved over the last 20 years choosing a Cy Young winner who is among the league leaders in WAR.

The Cy Young Award 2017, voted on by the BBWAA, was recently announced in each league for this season. As has happened more often than not recently, they chose a pitcher who ranks at or near the top of the league in Wins Above Replacement (WAR).

The American League Cy Young Award 2017 winner was Corey Kluber, who ranked second in the AL in Fangraphs WAR (fWAR) and first in Baseball-Reference WAR (bWAR).

While the Cy Young Award 2017 winner for the National League was Max Scherzer, who won his second consecutive Cy Young and third overall. He led the NL in fWAR and bWAR. This shows how the gap is narrowing between the writers and the “stats guys.” The recent choices for the top finishers in Cy Young voting have almost always been among the leaders in WAR.

This is progress. There was a time when many writers were strongly resistant to anything considered to be advanced statistical analysis. They voted for the major awards based on what they saw with their own eyes and the traditional statistics they had grown up appreciating, like home runs and RBIs for hitters and wins and ERA for pitchers. Times are changing.

In the American League, Corey Kluber led the league in wins and ERA, so his Cy Young aligns with the traditional metrics that voters have used for many years.

The number three finisher in the voting, Luis Severino, was ninth in the AL in wins and third in ERA. He was also third in fWAR and sixth in bWAR.

Severino’s finish shows that Cy Young Award 2017 voters are not over-valuing wins like they once did.

In the National League, Clayton Kershaw led the league in wins and ERA.

In past years, he would be the easy winner of the Cy Young, even though he finished fifth in fWAR and sixth in bWAR (mainly because he only pitched 175 innings).

Max Scherzer had two fewer wins than Kershaw and an ERA that was 0.20 higher, but he was the league leader in both versions of WAR and he took home the trophy. Nice job by the voters!

It’s been 40 years since the first edition of the Bill James Baseball Abstract came out, and many, if not most, writers look at a variety of statistics these days. Some of today’s BBWAA members grew up reading Bill James in the 1980s and 90s, Baseball Prospectus since the mid-1990s, and Fangraphs since it came online in 2005. MLB teams are incorporating all of these numbers into their valuation of players, so it would be foolish for any writer to ignore them.

BOSTON, MA – JUNE 23: Former Boston Red Sox player Pedro Martinez
BOSTON, MA – JUNE 23: Former Boston Red Sox player Pedro Martinez /

Cy Young Award 2017: The Difference Between WARs

To determine how much progress has been made by the BBWAA electorate, I compared the history of Cy Young winners to the two versions of WAR mentioned above, Fangraphs and Baseball-Reference. The framework for both versions of WAR are the same, but there are differences in the inputs each uses.

Both versions of WAR care about how many runs a pitcher allows and how many innings he pitches as a starting point, with league, ballpark, and other adjustments included. Essentially, fWAR uses Fielding Independent Pitching (FIP) as the baseline, while bWAR uses a pitcher’s actual runs allowed (both earned and unearned).

To understand the difference, consider Pedro Martinez when he was at his absolute best during the 1999 and 2000 seasons. The raw totals:

  • 23-4, 2.07 ERA, 213.3 IP, 313 K, 37 BB, 9 HR—1999
  • 18-6, 1.74 ERA, 217.0 IP, 284 K, 32 BB, 17 HR—2000

Both seasons were amazing, especially when you consider the level of offense at the time. In 1999, Mark McGwire hit 65 homers and Sammy Sosa blasted 63. Jeff Bagwell scored 143 runs and Manny Ramirez drove in 165. Larry Walker hit .379/.458/.710.

In 2000, Bagwell scored 152 runs and Todd Helton drove in 147 while hitting .372/.463/.698. In this era of incredible hitting, Pedro Martinez had a 1.90 ERA in 430.3 innings across two seasons. It was just unreal and he demonstrated his brilliance in the 1999 All-Star Game.

When it comes to comparing fWAR and bWAR, ask yourself which incredible Pedro Martinez season was better? In 1999, he had a higher ERA but struck out more hitters and allowed fewer home runs. In 2000, he had a lower ERA, but struck out fewer batters and allowed more home runs (almost double the amount).

Fangraphs WAR uses FIP, which is only interested in strikeouts, walks, hit by pitches, and home runs allowed. These are outcomes that don’t involve the defense. The idea is to isolate what the pitcher is most responsible for.

Baseball-Reference uses the pitcher’s actual runs allowed as one of the initial inputs for their version of WAR. It should be noted that the Fangraphs version of pitcher WAR adds infield flies in with strikeouts because they are also automatic outs, for the most part.

Fangraphs has Pedro’s 1999 season worth 11.6 WAR and his 2000 season worth 9.4 WAR, which makes sense when you look at his strikeouts, walks, and home runs allowed. Baseball-Reference has the seasons flipped, with his 1999 season being worth 9.7 WAR and his 2000 season being worth 11.7 WAR. If you average the two WARs together, then the seasons are essentially equal (roughly 10.5 WAR).

One of the big differences between the two seasons is Pedro’s Batting Average On Balls In Play (BABIP). Despite being so dominant in 1999, with 313 strikeouts in 213.3 innings, Pedro allowed a BABIP of .323.

This was the worst BABIP allowed of his career in any season in which he pitched 50 or more innings. The very next season, Pedro allowed a .236 BABIP. His career mark is .279.

What about the Red Sox defense in those two seasons? Were they much worse in 1999, when Pedro allowed a .323 BABIP? Actually, no. In 1999, all Red Sox pitchers combined to allow a .287 BABIP. In 2000, they allowed a .288 BABIP.

The Red Sox defense ranked third in baseball with 44 runs saved based on Total Zone in 1999. The next year, they were sixth in baseball with 39 runs saved. Defense doesn’t seem to be the reason for the difference in Pedro’s BABIP.

Does it make sense that Pedro was worse at allowing hits on balls in play in such a dominant season? Or could it have been some bad luck? The Fangraphs version of WAR doesn’t concern itself with BABIP because it’s not a factor in FIP. Baseball-Reference values Pedro according to his runs allowed, which is influenced by his BABIP. Thus, they value those two seasons differently.
MILWAUKEE – JUNE 03: Randy Johnson
MILWAUKEE – JUNE 03: Randy Johnson /

Cy Young Award 2017 and beyond, Winners Versus WAR

The Cy Young Award was given out for the first time in 1956. In the first 11 years, the award was given to only one pitcher in baseball, not one from each league.

This changed in 1967 when the best pitchers from each league were recognized for the first time. Two years later, there was a tie in the American League when Mike Cuellar and Denny McLain were co-winners. That is still the only tie in Cy Young Award history.

Including that tie, 114 Cy Young Awards have been handed out since 1956. The winner has matched the top pitcher in bWAR 49 percent of the time. The top pitcher in fWAR has won the Cy Young 45 percent of the time. That’s a difference of five pitchers in 62 seasons.

There has been a significant change in how often the Cy Young winner is the top pitcher in WAR over the last 60 years. The 1991 season looks like a good demarcation point. From 1956-1990, the Cy Young winner matched the top pitcher in bWAR 35 percent of the time.

Since then, they have matched 65 percent of the time. The fWAR leader matched the Cy Young winner 33 percent of the time from 1956-1990 and 57 percent of the time since.

  • 35%–Cy Young matched bWAR leader, 1956-1990
  • 65%–Cy Young matched bWAR leader, 1991-2017
  • 33%–Cy Young matched fWAR leader, 1956-1990
  • 57%–Cy Young matched fWAR leader, 1991-2017

When you expand it to consider how often the Cy Young winner finished in the top three in WAR, the improvement is even more impressive. Before 1990, this happened 43 percent of the time with bWAR and 33 percent of the time with fWAR. Since 1991, the Cy Young winner has finished in the top three in bWAR 81 percent of the time and in the top three in fWAR 80 percent of the time.

  • 43%–Cy Young finished in top 3 in bWAR, 1956-1990
  • 81%–Cy Young finished in top 3 in bWAR, 1991-2017
  • 33%–Cy Young finished in top 3 in fWAR, 1956-1990
  • 80%–Cy Young finished in top 3 in fWAR, 1991-2017

The last 11 years have been even more impressive. Since 2007, the Cy Young winner has finished in the top three in bWAR 91 percent of the time and in the top three in fWAR 95 percent of the time. These days, the Cy Young winner is almost always someone who is one of the best pitchers in baseball.

This development has eliminated the truly terrible choice. Over the last dozen years, there hasn’t been a Cy Young winner who did not finish in the top five in both versions of WAR. In years past, there were times when the Cy Young winner ranked between 26th and 30th in bWAR and as high as 79th in fWAR (1987 Steve Bedrosian). We don’t see those types of winners lately, such as the CY Young Award 2017 winners.

06 Apr 2002 : Bartolo Colon
06 Apr 2002 : Bartolo Colon /

Bad Picks in the Past, which the Cy Young Award 2017 winner an exception. 

In the AL, the last truly awful choice was Bartolo Colon in 2005. That year, Colon was 11th in bWAR and fifth in fWAR. He was worth three fewer wins than the guy who should have won the trophy, Johan Santana.

  • 21-8, 3.48 ERA, 3.78 FIP in 222.7 IP—Bartolo Colon
  • 16-7, 2.87 ERA, 2.80 FIP in 231.7 IP—Johan Santana

The difference was wins. Santana was much better at preventing runs and even pitched more innings than Big Bart, but Colon had five extra wins. At the time, that was enough for the voters to give the award to Colon. I don’t believe that would happen today. Had he won the award that year, Santana would have won three straight Cy Youngs.

In 2004, Roger Clemens (seventh in bWAR, fifth in fWAR) stole one from Randy Johnson (first in both) and once again there was a three-to-four WAR difference between the two hurlers. Clemens was worth 5.5 bWAR and 5.7 fWAR. The Big Unit was worth 8.5 bWAR and 9.6 fWAR. Here are the numbers:

  • 18-4, 2.98 ERA, 3.11 FIP in 214.3 IP—Roger Clemens
  • 16-14, 2.60 ERA, 2.30 FIP in 245.7 IP—Randy Johnson

Johnson pitched more innings and was much better at run prevention, but didn’t have the nice, shiny 18-4 record that Clemens had. On a side note, Johnson also threw a perfect game that year. If Johnson had won that Cy Young, he and Clemens would both have six each. Instead, Clemens has seven and Johnson has five.

Going further back, Bob Welch over Roger Clemens in 1990 was statistically the worst pick in the history of Cy Young voting. Bob Welch won the 1990 AL Cy Young because he won 27 games. That’s the only explanation. Consider the numbers:

  • 27-6, 2.95 ERA, 4.19 FIP in 238 IP—Bob Welch
  • 21-6, 1.93 ERA, 2.18 FIP in 228.3 IP—Roger Clemens

Welch put up his numbers while making 16 of his 35 starts in the best pitcher’s park in baseball and had the offensive support of one of the best hitting teams in the American League. He had a 1.92 ERA at home and 3.94 ERA on the road.

Clemens pitched in one of the worst parks in baseball for pitchers and his team’s offense was in the middle-of-the-pack in the AL. Despite pitching in a tough park for pitchers, he had a 1.53 ERA at home (2.31 on the road).

Welch had six more wins and that was enough for the voters at the time. He received 15 first-place votes out of the 28 votes cast. Clemens was the better pitcher in a more difficult park to pitch in but only received eight first-place votes so he finished second in the voting. This kind of result was much more common before the mid-1990s than it is now.

More from Call to the Pen

The Welch over Clemens vote in 1990 was the worst Cy Young pick ever based on the difference in bWAR between the winner and the guy who should have won. Clemens was worth 10.6 bWAR that year to Welch’s 3.0.

According to bWAR, there were 21 pitchers more valuable than Welch. It was also the worst choice based on fWAR, with Welch being worth 1.8 fWAR to Clemens’ 8.2. Based on fWAR, Welch was the 46th-best pitcher in baseball.

One other big change in Cy Young voting is the rarity over the last 25 years for a reliever to win the award. In the 16 years from 1977 to 1992, four AL relievers and three NL relievers won the Cy Young Award.

No AL reliever has one it since Eckersley in 1992 and only one, Eric Gagne, has won it in the NL since Mark Davis in 1989, with the Cy Young Award 2017 winner being no different.

Next: MLB Free Agents Tracker: Top 25 Pitchers

Voters are getting smarter and using more information, with the Cy Young award 2017 winners as proof. They seem to understand that a pitcher’s wins are dependent on many factors beyond his control and they are rewarding pitchers more for what they are responsible for, rather than factors beyond his control. This is progress.

Next