Minor league baseball MLB free agency puts the “R” in WAR

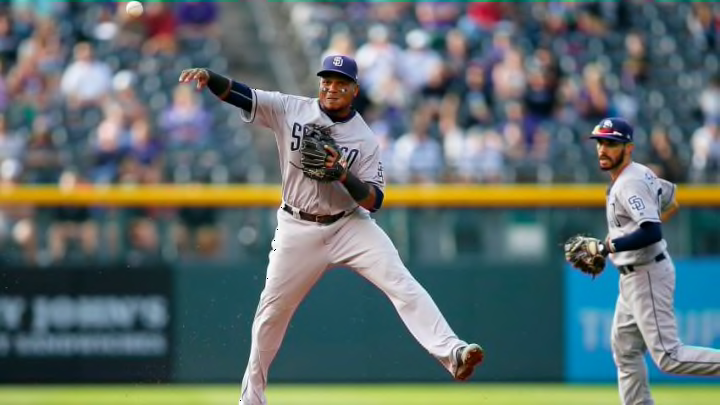
DENVER, CO - SEPTEMBER 17: Erick Aybar
3 of 3
Next
Minor league baseball
Minor league baseball /

Minor league baseball MLB free agency signings are a good proxy for the replacement level in Wins Above Replacement.

While there are still holdouts against Wins Above Replacement (WAR), it’s clear that WAR is here to stay. It’s used by analysts, of course, but also by fans and announcers. Even many Hall of Fame voters have embraced it. More and more, it’s becoming a reference point in baseball conversations. It may not be perfect, but to dismiss it out of hand is like rejecting CDs and clinging to cassette tapes in the 1980s or dismissing DVDs in favor of VHS tapes in the 1990s. It’s also useful when determining the future of MLB, with its Minor league baseball prospects.

Fangraphs defines WAR as “an attempt by the sabermetric baseball community to summarize a player’s total contributions to his team in one statistic.” It’s a way to value a player for everything he does, which is something baseball fans have been doing in their heads for years. WAR is meant to do objectively what fans have been doing subjectively.

You might have argued with a friend over which player is better, perhaps your favorite player versus her favorite player. If it’s a position player, you’ll talk about how well he can hit, if he can steal bases, and if he’s any good in the field. WAR combines all of this information into one number. If you look at the WAR leaderboards for a single season, you’ll find the best players in the game that year. If you look at the career leaders in WAR, you’ll see the all-time greats, like Babe Ruth, Barry Bonds, Willie Mays, and Walter Johnson.

The specifics of WAR were not chiseled into stone and presented as a finished product. The framework is foundational, but the specifics can be adjusted based on new information. Five years ago, there was a notable advancement in the metric when the two main versions of WAR, Fangraphs, and Baseball-Reference, agreed on a unified replacement level.

Replacement level is the “R” in WAR. As defined by baseball analyst Tangotiger, replacement level is “the talent level for which you would pay the minimum salary on the open market, or for which you can obtain at minimal cost in a trade.” Tango had replacement level equal to a .292 winning percentage in his blog post from 2008.

Before the grand unification five years ago, the Fangraphs replacement level was at .265 and Baseball-Reference was at .320. They came together and agreed upon .294. Essentially, this means that a team of replacement-level players would have a .294 winning percentage, which is a record of approximately 48-114 in a 162-game MLB season (see this link for the similarities and differences among Fangraphs WAR, Baseball-Reference WAR, and Baseball Prospectus WARP).

/

Minor league baseball: Real life replacement-level players

With all of that in mind, let’s consider the real-life value of replacement-level players. In late December, Tango tweeted that “Anyone who plays Fantasy sports has a(n implicit) 100% understanding of replacement level. If you don’t understand “replacement level,” then play Fantasy sports.”

In a comment later in that thread, Tango linked to ESPN’s transaction page that shows free agents who sign minor league contracts. These players can be used as proxies for the replacement-level players used in WAR. Before last season, this group included players who received significant playing time, like Austin Jackson and Mark Reynolds, but also players who didn’t play much at all, like Drew Stubbs and Gordon Beckham.

The poster children for this type of player are outfielder Corey Patterson, who was a minor league free agent signing in each of the last four years of his career, and pitcher Jamey Wright, who had big league playing time as a minor league free agent signing five times. These guys are on the bubble between continuing their major league career or washing out of baseball. Many were regular starters in prior years, but are getting older, and their skills have declined. They’re just looking to stay in the game.

Accompanying his link to ESPN’s transaction page was a suggestion by Tango that someone total the WAR, PA, and IP of these players to see how well the two versions of WAR held up (fWAR refers to Fangraphs version and rWAR refers to Baseball-Reference’s version). I took the suggestion and looked at the numbers.

Using the ESPN link, I found all of the free agents offered minor league contracts each year from 2006 to 2015. This produces 10 years of replacement-level players to analyze. Then, after some back-and-forth emails with Tango, I looked at the statistics of these players starting two years before they were signed and continued to the year after they were signed. This gives us a look at the value of these players over a four-year stretch.

/

It should be noted that I’m only looking at players who were offered minor league baseball contracts and then went on to play in the major leagues that year. Not all players who signed minor league contracts played in the majors. For hitters, roughly 62 percent of players signed accumulated MLB playing time that year. For pitchers, it was around 58 percent. A good portion of these signings doesn’t make it out of spring training with the big league club.

Let’s look at the hitters first. The year the player signs a minor league contract is year T. The previous two years are T-2 and T-1 and the year after the player signs is T+1. Remember that the player pool is determined by year T. There are fewer players in the years prior to year T because some players didn’t have major league playing time in one of those two years (possibly due to injuries or spending the year in the minor leagues).

Year T-2:

133 players

Average: 286 PA, 0.3 fWAR, 0.3 rWAR

Year T-1:

135 players

Average: 230 PA, -0.1 fWAR, 0.0 rWAR

Year T:

140 players

Average: 152 PA, 0.2 fWAR, 0.1 rWAR

Year T+1:

61 players

Average: 206 PA, 0.3 fWAR, 0.2 rWAR

Looking at the numbers above, we find that these players are at their best and get the most playing time two years before they sign minor league baseball MLB free agency contracts. Then they collectively play worse, which is likely a big reason they have to settle for a minor league contract and an invitation to spring training. Then, although they don’t get as much playing time, they do perform better during the year they sign as minor league free agents.

Teams essentially “bought low” on these players and got slightly better than replacement level production when they bounced back. Based on 10 years worth of data, we find that the value major league teams are getting out of these position players who sign minor league contracts is slightly higher than we would expect. Perhaps the WAR baseline is marginally lower than it should be?

TORONTO, ON – JUNE 30: Blaine Boyer
TORONTO, ON – JUNE 30: Blaine Boyer /

Minor league baseball: Analyzing the pitchers

The results are similar for pitchers:

Year T-2:

132 pitchers

Average: 74 IP, 0.4 fWAR, 0.3 rWAR

Year T-1:

140 pitchers

Average: 63 IP, 0.1 fWAR, -0.1 rWAR

Year T:

148 pitchers

Average: 47 IP, 0.2 fWAR, 0.2 rWAR

Year T+1:

80 pitchers

Average: 60 IP, 0.4 fWAR, 0.3 rWAR

More from Call to the Pen

Like the position player group, the worst season for these pitchers is the year before they sign minor league contracts (T-1). That’s the biased year. Coming off bad seasons, these players don’t get big contract offers and have to settle for a minor league contract and invitation to spring training. They bounce back and provide slightly above replacement-level value.

Based on these real-life players over a 10-year period, it appears that MLB teams who sign free agents to minor league contracts get slightly more production than the WAR baseline would expect out of what are, essentially, replacement-level players (based on how easy they were to acquire). It’s possible that the WAR baseline is slightly low. Perhaps instead of .294, it should be .300 or .310.

The difference is small, though, and there are other factors to consider. The sample of players could be biased. My player pool came from the ESPN link that shows minor league free agent signings. I don’t know if their list is complete. Most years had 20 or more such signings, but the link for 2012 only had a few, which seems odd to me.

Next: ACES agency accused of providing MLB players with PEDs

Another group of Minor league baseball players who could be added to the pool are offseason waiver claims. Perhaps if these players had been added, the outcome would be different. Overall, though, based on 10 years of data, these minor league free agent signings who get major league playing time perform slightly better than replacement level.
Next