MLB: 5 most predictable hitters for 2018

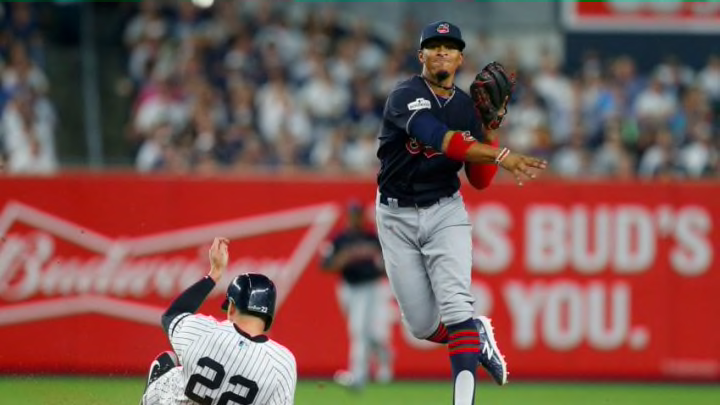
NEW YORK, NY - OCTOBER 08: (NEW YORK DAILIES OUT) Francisco Lindor
2 of 6
Next
NEW YORK, NY – OCTOBER 08: (NEW YORK DAILIES OUT) Francisco Lindor
NEW YORK, NY – OCTOBER 08: (NEW YORK DAILIES OUT) Francisco Lindor /

These are the five hitters who have the least variation in their 2018 MLB projections based on seven different sources.

So much of life is about anticipation. When we’re young, we look forward to being old enough to drive or get our first legal drink. Somewhere along the way, we dream about falling in love and our first kiss. We think about what job we’ll have in the future and where we might live. When we’re older, we spend the winter thinking about what we’ll do next summer. In the spring, we look forward to the fall. It’s an ongoing cycle. For many MLB fans, the end of the season is a time to think about the offseason moves our favorite team will make.

Will they make a big trade or sign a free agent? Is it time for that excellent, young MLB prospects to crack the Opening Day lineup? Does that aging veteran still have one more good season left in him?

When spring training rolls around and the rosters are mostly set, baseball fans can think about how their favorite players will do in the upcoming season. For diehard fans, the best resource for predicting player statistics are the many projections available online. I recently did this for 2018. I used the following sources for projections:

There are 302 MLB players with roughly 200 or more plate appearances who appear on all seven lists. Before comparing them to find the most predictable hitters, I adjusted to put all of the sources on a level playing field. For example, these 302 hitters were projected by ATC to have a .266/.335/.447 (.782 OPS) batting line, but ZiPS had them hitting .261/.328/.438 (.766 OPS). That’s a difference in OPS of .016.

It looks like ATC is projecting a higher run-scoring environment than ZiPS. To compare these players, I want them expected for the same run-scoring environment. If I left the player’s stat lines unadjusted, then ZiPS would likely be the low source for many players. I want them on a level playing field, so I adjusted each player so that the entire group of players for each source has a .264/.333/.443 batting line, which is the average of all of the groups combined.

Using these adjusted numbers, I found the standard deviation for each player in OPS (on-base percentage plus slugging percentage). Players with a smaller standard deviation have projections that are more similar than those with a higher standard deviation. I also used the standard deviation of their projected plate appearances as an additional factor. They are the most predictable hitters, based on these seven sources of projections (statistics for each player are his adjusted statistics).

NEW YORK, NY – OCTOBER 08: (NEW YORK DAILIES OUT) Francisco Lindor
NEW YORK, NY – OCTOBER 08: (NEW YORK DAILIES OUT) Francisco Lindor /

MLB: Francisco Lindor, Cleveland Indians

  • 657 PA, .291/.354/.488, .842 OPS—Average of all sources
  • 658 PA, .293/.357/.492, .849 OPS—Best projection (Steamer)
  • 653 PA, .292/.354/.481, .835 OPS—Worst projection (THE BAT)

At the very top of the list of players with the most similar projections from these seven sources is Francisco Lindor, a two-time all-star and top-five finisher in AL MVP voting last season. Every source has Lindor with a batting average between .287 and .294, an on-base percentage between .348 and .357, and a slugging percentage between .481 and .492. The average of all the sources (shown above) would be a higher on-base percentage and slugging percentage than Lindor’s career marks, but he is playing his age-24 season so it wouldn’t be unusual for him to be still improving.

One thing to note is that the shape of Lindor’s offense changed last year. In 2016, he had a .358 OBP and .435 slugging percentage. Last year, those numbers were .337 and .505, and Lindor more than doubled his previous best home run mark from 15 to 33. His batted ball profile showed a significant increase in hard hit percentage, from 27.5 percent to 35.2 percent, along with a big increase in fly ball rate, from 28.4 percent to 42.4 percent. It looks like Lindor was part of the “fly ball revolution.” If he continues down the same path, he will hit with more power and a lower on-base percentage, like he did last year (.273/.337/.505).
TAMPA, FL – MARCH 04: Denard Span
TAMPA, FL – MARCH 04: Denard Span /

MLB: Denard Span, Tampa Bay Rays

  • 492 PA, .268/.330/.401, .731 OPS—Average of all sources
  • 526 PA, .268/.332/.407, .739 OPS—Best projection (ATC)
  • 523 PA, .268/.329/.397, .726 OPS—Worst projection (ZiPS)

Like Francisco Lindor, Denard Span has a very narrow range of projections in each of the three rate categories, but particularly so in on-base percentage and slugging percentage. The low projection for Span’s OBP is .327, just five points lower than his high projection of .332. His range for slugging percentage is from .395 to .407. This is who Denard Span is, a guy who will hit close to .270, with a .330-ish OBP and .400 slugging percentage.

The projections also expect Span to continue to hit for a bit more power than he did for most of his career. In his first eight seasons in the big leagues, he averaged five home runs per season, taking the pitcher deep once every 107 plate appearances. He’s averaged 11.5 home runs per season over the last two years, leaving the park once every 49 plate appearances. The projections have him hitting between eight and 11 big flies in 2018.

Span turned 34 in February and is no longer the guy who stole a career-high 31 bases with the Nationals in 2014. He’s averaged around 12 steals per season since then and is projected to steal 11 this year. Of course, the Rays might want to put the brakes on Span. He’s been successful just 63 percent of the time over the last two seasons. That’s not helpful.

https://calltothepen.com/wp-content/uploads/getty-images/2018/02/866251430-kansas-city-royals-v-new-york-yankees
https://calltothepen.com/wp-content/uploads/getty-images/2018/02/866251430-kansas-city-royals-v-new-york-yankees /

MLB: Mike Moustakas, Kansas City Royals

563 PA, .267/.324/.490, .814 OPS—Average of all

538 PA, .268/.327/.493, .820 OPS—Best projection (Steamer)

586 PA, .265/.317/.486, .803 OPS—Worst projection (ATC)

The man who last season passed Steve “Bye Bye” Balboni to set the single-season record for home runs by a Kansas City Royal is the third most predictable hitter on this list. All seven sources project Moustakas to have an OPS between .803 and .820, which is below the .835 mark he put up last year but well above his career .730 OPS. The projections see a little less power and slightly better on-base numbers for Moose compared to last season. The average of all seven sources have him hitting 29 home runs with 79 RBI.

Despite coming off a 38-homer season, Moustakas didn’t sign a free agent contract until well into spring training, and it was just a one-year deal with a mutual option for 2019. He’s guaranteed $5.5 million in salary for this year, with $2.2 million in incentives for reaching certain thresholds in plate appearances (he’ll earn the entire $2.2 million if he reaches 450 PA). The mutual option is for $15 million in 2019 or a $1 million buyout. Of the four core Royals who were eligible for free agency, Moustakas and Alcides Escobar are back in blue. Lorenzo Cain and Eric Hosmer have moved on.

getty-images/2018/02/922502374-san-diego-padres-spring-training
getty-images/2018/02/922502374-san-diego-padres-spring-training /

MLB: Eric Hosmer, San Diego Padres

628 PA, .286/.356/.461, .817 OPS—Average of all sources

623 PA, .290/.360/.467, .827 OPS—Best projection (THE BAT)

653 PA, .281/.351/.456, .807 OPS—Worst projection (ZiPS)

It’s surprising that Eric Hosmer has such a narrow range of projections considering how up-and-down his career has been. He’s the Bret Saberhagen for the Millennial crowd. In his seven big league seasons, his OPS has gone from .799 to .663 to .801 to .716 to .822 to .761 to last year’s career-best .882. He’s hit as high as .318 and as low as .232. His best on-base percentage was last year’s .385. His worst was in 2012 when he barely topped .300. He also had a career-low .359 slugging percentage in 2012, which was almost 130 points below his career-best .498 mark last season.

Despite the yo-yo pattern of Hosmer’s career, all seven projection sources are very much in agreement about what to expect in 2018. He’ll hit somewhere in the .280-.290 range with an OBP in the .350s and a slugging percentage in the .460 range. That would be a step down from last year’s .318/.385/.498 and put Hosmer in the vicinity of 2-3 Wins Above Replacement (WAR). For that, he’ll be paid $144 million over the next eight years. Meanwhile, former teammate Mike Moustakas is projected for 2.7 WAR this year and recently signed a one-year contract with an option for a second.

(Photo by Elsa/Getty Images)
(Photo by Elsa/Getty Images) /

MLB: Didi Gregorius, New York Yankees

  • 588 PA, .271/.314/.439, .753 OPS—Average of all
  • 594 PA, .269/.317/.447, .764 OPS—Best projection (Davenport)
  • 593 PA, .269/.311/.435, .746 OPS—Worst projection (ZiPS)

Most, if not all, projection systems start with a basic Marcels-like framework that uses the last three (or more) seasons of statistics from that player to project what he’ll do going forward. The most recent seasons are weighted more than past seasons, but those past seasons still have an influence. In the case of Gregorius, this three-year stretch of play includes his 2015 season, when he hit .265/.318/.370. Those were the days when he was known as a light-hitting shortstop who struggled against left-handed pitching.

After not hitting much in his first four seasons, Gregorius broke out with a 20-HR season in 2016 and followed it up with 25 more home runs last year. With his 2015 season still being part of the projection framework, the seven sources expect him to hit a little more as he did in 2016 than 2017. That would give him around 20 homers and 70-80 RBI instead of the 25-HR, 87-RBI season he had last year. On the powerhouse Yankees team, that might place him fifth on the team in those two categories, behind Giancarlo Stanton, Aaron Judge, Gary Sanchez, and Greg Bird.

Next: MLB’s tampering accusations of Aaron Judge are ridiculous

Projections aren’t foolproof, of course, but there is a method behind the numbers. These are the five players who have the most-similar predictions from seven sources. Up next will be the five players who have the least-similar projections from these sources.

Next