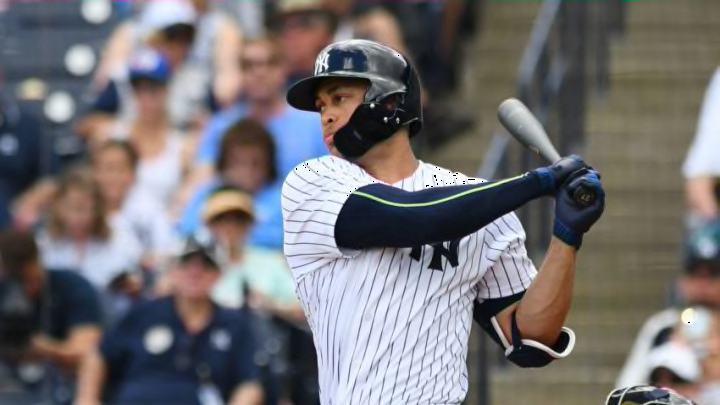
These are the five MLB hitters who have the most variation in their 2018 projections based on seven different sources.
Previously, I wrote about the MLB five hitters with the least variation in their 2018 projections. Now it’s time for the five hitters with the most variation in their 2018 projections. The players in the most predictable group all had a projected OPS from all seven sources within 0.20 of each other. Their high projection wasn’t that much different from their low forecast.
Today’s group has large differences between their high and low projections. All five players highlighted have at least a difference of .080 in OPS from their most optimistic forecast to their least optimistic forecast. Three of these players have a difference of more than .100. This group includes a pair of sturdy teammates on a prominent AL East team and a pair of less powerful teammates on a less noticeable AL West team.
As a reminder, below are the sources used for each player’s projection and the method I used to compare the players.
There are 302 MLB players with roughly 200 or more plate appearances who appear on all seven lists. Before comparing them to find the least predictable hitters, I adjusted to put all of the sources on a level playing field. For example, these 302 hitters were projected by ATC to have a .266/.335/.447 (.782 OPS) batting line, but ZiPS had them hitting .261/.328/.438 (.766 OPS). That’s a difference in OPS of .016.
It looks like ATC is projecting a higher run-scoring environment than ZiPS. To compare these players, I want them expected for the same run-scoring environment. If I left the player’s stat lines unadjusted, then ZiPS would likely be the low source for many players. I want them on a level playing field, so I adjusted each player so that the entire group of players for each source has a .264/.333/.443 batting line, which is the average of all of the groups combined.
Using these adjusted numbers, I found the standard deviation for each player in OPS (on-base percentage plus slugging percentage). MLB players with a higher standard deviation have projections that are less similar than those with a lower standard deviation. They are the least predictable hitters, based on these seven sources of projections (statistics for each player are his adjusted statistics).
