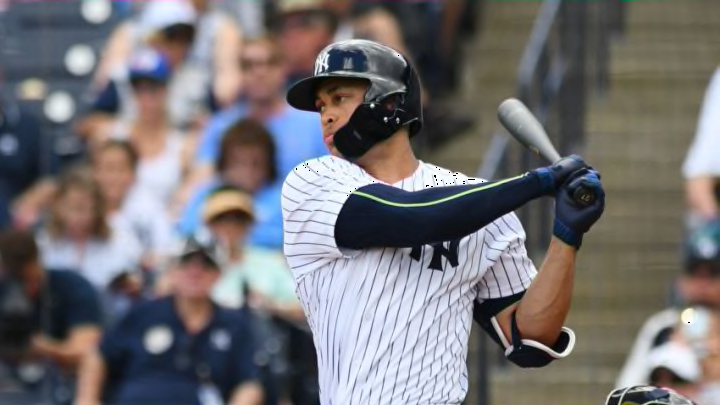
MLB: Jonathan Lucroy, Oakland Athletics
- 462 PA, .276/.346/.425, .771 OPS—Average of all
- 482 PA, .300/.370/.454, .824 OPS—Best projection (ZIPS)
- 430 PA, .259/.323/.398, .721 OPS—Worst projection (Davenport)
A second Oakland A’s player makes this list, and it shouldn’t be a big surprise that it’s Jonathan Lucroy. As mentioned in my previous post about the most predictable players for 2018, many projection systems use at least three years of data to project a player’s stats.
For Lucroy, this means his ugly 2015 MLB season (.264/.326/.391) is included with his outstanding 2016 season (.292/.355/.500) and his ugly-again 2017 season (.265/.345/.371). Lucroy’s home run total has gone from seven to 24 to six over the last three years.
So, will the real Jonathan Lucroy please stand up? Is he the guy ZiPS projects him to be, a .300/.370/.454 hitter, who will knock in 61 runs in 482 plate appearances? Or is he the .259/.323/.398 hitter, who will knock in 45 runs in 430 plate appearances that Clay Davenport expects? The average of all seven projection sources has him finishing right in between ZiPS and Davenport.
A look at Lucroy’s batted ball profile reveals that he hit more ground balls than he ever had last year (53.5 percent compared to a 42.7 percent career mark). He also had his lowest hard hit percentage in the previous six years. Not even playing 27 games at Coors Field will help a guy overcome a 22.3 hard hit percentage.
For reference, that’s in the vicinity of Ender Inciarte, Cesar Hernandez, and Jose Peraza. Those guys have enough speed to get away with such a low hard hit percentage. Lucroy doesn’t.
