MLB: The five least predictable hitters for 2018

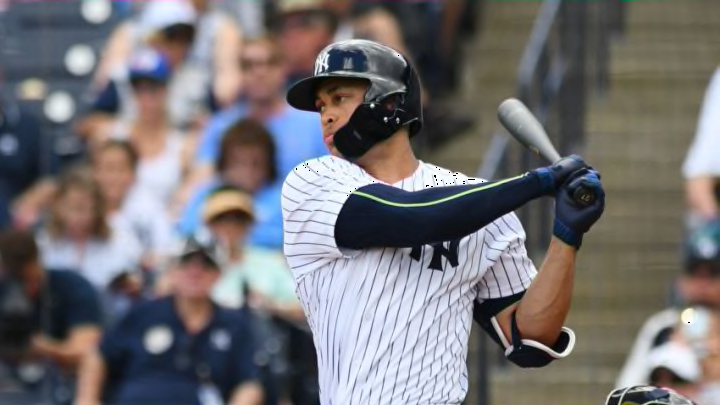
TAMPA, FL - FEBRUARY 23: Giancarlo Stanton
5 of 6
Next

These are the five MLB hitters who have the most variation in their 2018 projections based on seven different sources.

Previously, I wrote about the MLB five hitters with the least variation in their 2018 projections. Now it’s time for the five hitters with the most variation in their 2018 projections. The players in the most predictable group all had a projected OPS from all seven sources within 0.20 of each other. Their high projection wasn’t that much different from their low forecast.

Today’s group has large differences between their high and low projections. All five players highlighted have at least a difference of .080 in OPS from their most optimistic forecast to their least optimistic forecast. Three of these players have a difference of more than .100. This group includes a pair of sturdy teammates on a prominent AL East team and a pair of less powerful teammates on a less noticeable AL West team.

As a reminder, below are the sources used for each player’s projection and the method I used to compare the players.

There are 302 MLB players with roughly 200 or more plate appearances who appear on all seven lists. Before comparing them to find the least predictable hitters, I adjusted to put all of the sources on a level playing field. For example, these 302 hitters were projected by ATC to have a .266/.335/.447 (.782 OPS) batting line, but ZiPS had them hitting .261/.328/.438 (.766 OPS). That’s a difference in OPS of .016.

It looks like ATC is projecting a higher run-scoring environment than ZiPS. To compare these players, I want them expected for the same run-scoring environment. If I left the player’s stat lines unadjusted, then ZiPS would likely be the low source for many players. I want them on a level playing field, so I adjusted each player so that the entire group of players for each source has a .264/.333/.443 batting line, which is the average of all of the groups combined.

Using these adjusted numbers, I found the standard deviation for each player in OPS (on-base percentage plus slugging percentage). MLB players with a higher standard deviation have projections that are less similar than those with a lower standard deviation. They are the least predictable hitters, based on these seven sources of projections (statistics for each player are his adjusted statistics).

MLB: Giancarlo Stanton, New York Yankees

  • 607 PA, .275/.367/.622, .989 OPS—Average of all sources
  • 630 PA, .281/.375/.648, 1.034 OPS—Best projection (Fangraphs DC)
  • 623 PA, .263/.352/.559, .911 OPS—Worst projection (Davenport)

The big slugger who made his way from Miami to New York in the offseason is projected to be very good again in 2018, but the very good projected by the Fangraphs Depth Charts is quite a bit better than the very good projected by Clay Davenport. The high and low projections for Stanton have a difference of over a 100 points of OPS, with much of that difference coming in slugging percentage.

Stanton slugged a career-high .631 last year. The Fangraphs Depth Chart adjusted projection has him setting a new career high with a .648 slugging percentage this year. Clay Davenport’s projected slugging percentage of .559 pales in comparison, but would still be one of the best in baseball. It should be pointed out that Stanton only slugged .489 in 2016. He was sidelined with a groin injury in August that year that ultimately ended his season.

Looking at all seven projections reveals that Clay Davenport and Marcels have similar projected rate stats (.911 OPS for Davenport, .912 for Marcels). The Fangraphs Depth Charts, Steamer, ZiPS, and BAT are all very much in agreement, projecting Stanton to have an OPS in the 1.030 range. Right in the middle is ATC, planning Stanton to have a .975 OPS.

MESA, AZ – FEBRUARY 22: Matt Olson
MESA, AZ – FEBRUARY 22: Matt Olson /

MLB: Matt Olson, Oakland Athletics

  • 554 PA, .235/.330/.478, .808 OPS—Average of all sources
  • 311 PA, .257/.347/.540, .887 OPS—Best projection (Marcels)
  • 618 PA, .218/.312/.441, .753 OPS—Worst projection (BAT)

On a per plate appearances basis, the best home run hitter in baseball last year was not Giancarlo Stanton or Aaron Judge. It wasn’t veteran Nelson Cruz or newcomers Cody Bellinger or Rhys Hoskins. It wasn’t 45-homer man J.D. Martinez or 43-homer man Khris Davis. The best home run hitter in baseball on a per plate appearances basis was Davis’ teammate with the Oakland A’s, Matt Olson.

Olson came up from the minor leagues and started crushing dingers like Sarah Hyland crushes tacos. Olson only played 59 MLB games last year, but still hit 24 home runs in less than half a season. He led baseball in home runs per plate appearance and home runs per fly ball for players with 200 or more plate appearances.

The difference between the most optimistic projection and the least optimistic projection for Olson is 134 points of OPS, the most substantial difference of any of these players. Marcels loves him, projecting a .257/.347/.540 batting line, albeit in just 311 plate appearances. Derek Carty’s THE BAT projection is lukewarm–.218/.312/.441. Overall, the seven sources averaged together see Olson crushing 30 homers, which is about three days worth of tacos for Sarah Hyland.

DENVER, CO – SEPTEMBER 30: Colorado Rockies catcher Jonathan Lucroy
DENVER, CO – SEPTEMBER 30: Colorado Rockies catcher Jonathan Lucroy /

MLB: Jonathan Lucroy, Oakland Athletics

  • 462 PA, .276/.346/.425, .771 OPS—Average of all
  • 482 PA, .300/.370/.454, .824 OPS—Best projection (ZIPS)
  • 430 PA, .259/.323/.398, .721 OPS—Worst projection (Davenport)

A second Oakland A’s player makes this list, and it shouldn’t be a big surprise that it’s Jonathan Lucroy. As mentioned in my previous post about the most predictable players for 2018, many projection systems use at least three years of data to project a player’s stats.

For Lucroy, this means his ugly 2015 MLB season (.264/.326/.391) is included with his outstanding 2016 season (.292/.355/.500) and his ugly-again 2017 season (.265/.345/.371). Lucroy’s home run total has gone from seven to 24 to six over the last three years.

So, will the real Jonathan Lucroy please stand up? Is he the guy ZiPS projects him to be, a .300/.370/.454 hitter, who will knock in 61 runs in 482 plate appearances? Or is he the .259/.323/.398 hitter, who will knock in 45 runs in 430 plate appearances that Clay Davenport expects? The average of all seven projection sources has him finishing right in between ZiPS and Davenport.

A look at Lucroy’s batted ball profile reveals that he hit more ground balls than he ever had last year (53.5 percent compared to a 42.7 percent career mark). He also had his lowest hard hit percentage in the previous six years. Not even playing 27 games at Coors Field will help a guy overcome a 22.3 hard hit percentage.

For reference, that’s in the vicinity of Ender Inciarte, Cesar Hernandez, and Jose Peraza. Those guys have enough speed to get away with such a low hard hit percentage. Lucroy doesn’t.

MLB: Aaron Judge, New York Yankees

  • 615 PA, .257/.370/.539, .910 OPS—Average of all sources
  • 549 PA, .272/.393/.565, .958 OPS—Best projection (Marcels)
  • 625 PA, .249/.350/.509, .859 OPS—Worst projection (Davenport)

As good as Aaron Judge was last year when he had an on-base percentage over .400 and a slugging percentage over .600, you have to remember how bad he was in a 27-game stint in the big leagues in 2016. That year, he hit .179/.263/.345 and struck out 44.2 percent of the time in 95 PA. Before playing in the bigs, he’d hit a good-but-not-great .270/.366/.489 in 93 Triple-A games. In 2015, Judge hit well in Double-A but struggled in Triple-A as a 23-year-old.

Even during last year’s terrific MLB season, Judge had a hideous 49-game stretch from July 8 to September 3. He hit .181/.338/.351 and struck out 77 times in 213 plate appearances (36.1 percent strikeout rate). Then he righted the ship and crushed baseballs for the rest of September. We’ve seen the best of Judge and the worst of Judge, not only over the last few years but in a single season.

So put it all together and what do you have? You have some disagreement among the projections for the big outfielder in the Bronx. Most of the projections have Judge hitting in the .255 range, but Clay Davenport has him at .249 and Marcels has him at .272.

The consensus on his on-base percentage is in the upper .360s, but Davenport has him at .350 and Marcels has him at .393. For slugging percentage, there’s a range from the .509 projected by Davenport to .517 projected by Steamer to .557 projected by ZiPS and .565 projected by Marcels.
MLB: Ryon Healy, Seattle Mariners

  • 559 PA, .267/.305/.441, .746 OPS—Average of all
  • 531 PA, .280/.322/.474, .796 OPS—Best projection (Marcels)
  • 619 PA, .256/.291/.421, .7212 OPS—Worst projection (ZiPS)

More from Call to the Pen

Healy is one of the many injured Mariners and may not be ready to go when the season starts. He was acquired by Seattle in an offseason trade with the A’s for pitcher Emilio Pagan and minor leaguer Alexander Campos. He hit 25 homers last season, which would have been impressive three years ago but not so much in the big home run season of 2017.

Back in the deader ball year of 2014, 25 home runs were good for tied for 21st in all of baseball. Last season, Healy’s 25 home runs were tied for 67th. The times they are a-changing.

Healy’s best projection is from Marcels, a system that works better with more major league playing time, preferably three full seasons. Healy only has one-and-a-half years in the big leagues, so Marcels regresses his numbers towards league average.

Other systems use minor league data for their projections. Marcels and Clay Davenport project Healy to have a .322 on-base percentage. Steamer and ZiPs come in nearly 30 points lower, at .295 and .291, respectively. Marcels has Healy with a .474 slugging percentage, which is more than 50 points higher than the ZiPS projection of .421.

Next: The five most predictable hitters for 2018

The Mariners are hoping Healy hits like Marcels projects because he won’t provide much value in the field or running the bases. The low projection from ZiPS would make Healy below replacement-level (-0.3 WAR at Fangraphs). Adding insult to injury, ZiPS projects the player the Mariners traded away to get Healy, Emilio Pagan, to be worth 0.4 WAR.

Next