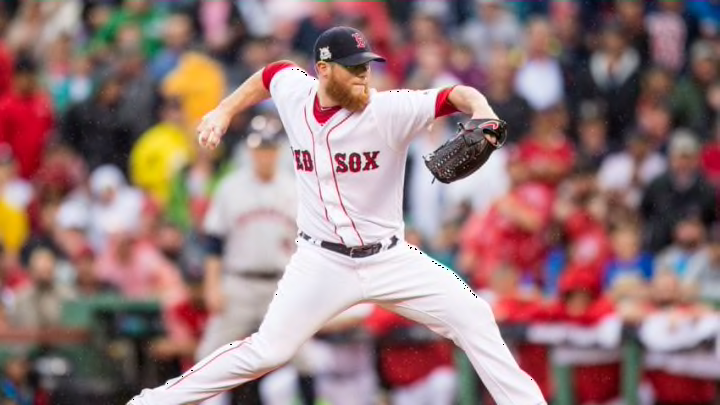
These are five MLB pitchers who have the least variation in their 2018 projections based on six different sources.
Previously, I wrote about the five most predictable MLB hitters for 2018, then the five least predictable hitters for 2018. Now it’s time for the most predictable pitchers. Each pitcher had a high ERA projection that was not much higher than his low ERA projection. The most significant range was a difference of 0.17 in ERA.
Also, all of these pitchers had a low standard deviation in projected ERA among all six sources. Below are the six sources used for each player’s projection and the method I used to compare the players.
There are 416 MLB pitchers who appear on all six lists. Before comparing them, I adjusted to put all of the sources on a level playing field. For example, these 416 pitchers were projected by the Clay Davenport projections to have a 4.27 ERA, while ATC projected them to have a 4.04 ERA.
It looks like Davenport is projecting a higher run-scoring environment than ATC. To compare these pitchers, I want them expected for the same run-scoring environment, so I adjusted each pitcher so that the entire group had an ERA of 4.17, which was the average of all six sources.
Using these adjusted numbers, I found the standard deviation for each MLB pitcher in ERA. Pitchers with a lower higher standard deviation have projections that are more similar than those with a higher standard deviation. They are the most predictable pitchers, based on these six sources of projections (statistics for each player are his adjusted statistics).
