MLB Rankings: The most prolific Three True Outcomes hitters

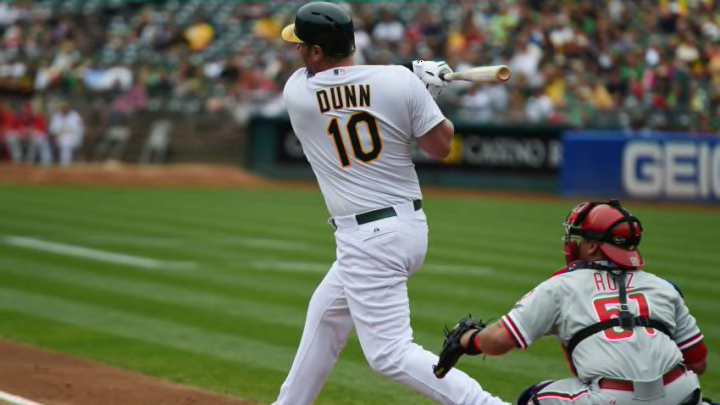
OAKLAND, CA - SEPTEMBER 21: Adam Dunn #10 of the Oakland Athletics hits an rbi single scoring Coco Crisp #4 against the Philadelphia Phillies in the bottom of the first inning at O.co Coliseum on September 21, 2014 in Oakland, California. (Photo by Thearon W. Henderson/Getty Images)
5 of 5
Next

Three True Outcomes who last more than a few seasons are pretty rare. It’s a delicate balance and any one variable changing too much can make the whole approach collapse overnight. So it’s no surprise that there aren’t any real Three True Outcomes hitters among the all time greats. What may be surprising is what names landed in our MLB Rankings top 10 for this highly unusual group!

Last week we took a look at Red Sox prospect Bobby Dalbec, and by proxy Joey Gallo, through the lens of Three True Outcomes (TTO). TTO is the combination of strikeouts, walks and home runs, or the outcomes that do not involve defenders. We’ll ignore the the small percentage of home runs that are actually playable here. Today we thought we would take the next step and get into the all time leaders for this esoteric category!

The top twenty hitters by percentage in the piece linked above was heavily skewed toward current players. That may be a function of the shift toward trading power for contact that we’ve seen lately. We filtered out hitters with batting averages of .250 or higher because we wanted to stay away from all time great hitters who just happen to have amassed an enormous amount of home runs and walks. For this look we’re going to add another criteria; longevity. So this all time list will of hitters with the highest percentage of their plate appearances ending in a TTO who have batting averages below .250 and who were able to survive in the majors long enough to accrue at least 2000 PA.

And with that, we’ll get to the list!

LAS VEGAS, NV – MARCH 17: Mike Napoli (32) of the Indians looks on during a game between the Chicago Cubs and Cleveland Indians as part of Big League Weekend on March 17, 2018 at Cashman Field in Las Vegas, Nevada. (Photo by Jeff Speer/Icon Sportswire via Getty Images)
LAS VEGAS, NV – MARCH 17: Mike Napoli (32) of the Indians looks on during a game between the Chicago Cubs and Cleveland Indians as part of Big League Weekend on March 17, 2018 at Cashman Field in Las Vegas, Nevada. (Photo by Jeff Speer/Icon Sportswire via Getty Images) /

#10: Mike Napoli – 44.75%

Having suffered a torn ACL and meniscus before having a single AB at the major league level this season, we may have seen the end of Mike Napoli’s career, unfortunately. He was a big part of several playoff runs, none more notable than the 2013 World Series championship for the Boston Red Sox. If his career is, indeed, done he will have finished with a .246/.346/.475 triple slash, 297 HR, 650 BB and 1468 K. That’s 2,385 TTO’s for those counting at home, and if this was an all time list for most TTO’s, he’d rank 4th. He also has the 4th most PA of anyone on this list.

At his peak, Mike Napoli had tremendous bat speed and the physique of a lumberjack. Mike Napoli was a huge part of getting past the Detroit Tigers in the 2013 ALCS, posting a 1.033 OPS that series with 2 HR and 2 2B. He will likely never have to buy a drink in the city of Boston ever again because of his part in that unlikely title run.

His run in Boston was almost derailed before it began when it was discovered that he had a degenerative condition in his hips which could have led to them fracturing. This is the same condition that ended Bo Jackson’s career. When managed with medication, however,  its effects can be pushed off. Thankfully for Red Sox fans, the team and this bearded slugger were able to come to terms in a way that satisfied both parties. Because without him we wouldn’t have had this night to look back upon.

Mike Napoli has played for the Los Angeles Angels, the Texas Rangers, the Boston Red Sox, and the Cleveland Indians.

PHOENIX, AZ – APRIL 20: Alex Avila #5 of the Arizona Diamondbacks gets ready in the batters box against the San Diego Padres at Chase Field on April 20, 2018 in Phoenix, Arizona. (Photo by Norm Hall/Getty Images)
PHOENIX, AZ – APRIL 20: Alex Avila #5 of the Arizona Diamondbacks gets ready in the batters box against the San Diego Padres at Chase Field on April 20, 2018 in Phoenix, Arizona. (Photo by Norm Hall/Getty Images) /

#9: Alex Avila – 44.98%

Alex Avila is still playing and at just 31 years old has plenty of time to move up or down this list. But for now, he slots in at number 9. He has the 6th most TTO’s on the list, but is more than 800 behind 5th. Avila is one of only two catchers on the list and the only one to remain primarily a backstop throughout his career. That could change before he retires, but to date has 760 games out of 876 in which he has spent time behind the plate.

His career to date has led to four postseason appearances, including a trip to the World Series in 2012 where the Tigers were swept by the San Francisco Giants. He has a good chance to get back to October baseball this year, however, as the Diamondbacks are off to a great start and currently lead their division.

The Diamondbacks catcher is currently sitting at .241/.350/.398 with 98 HR, 436 BB, and 881 K for 1,415 TTO’s and counting. Of course, with a 58 wRC+ he will need to pick up the pace if he intends to continue his career after this season. It’s probably not a big worry, though. His hard hit percentage and average exit velocity are both steady and his launch angle hasn’t changed much either. As his .280 BABIP indicates, he seems to be dealing with some poor luck on balls in play.

Alex Avila has played for the Detroit Tigers, the Chicago White Sox and the Arizona Diamondbacks.

Next: #7/8

CHICAGO, IL – SEPTEMBER 27: Carlos Pena #23 of the Tampa Bay Rays bats against the Chicago White Sox at U.S. Cellular Field on September 27, 2012 in Chicago, Illinois. The Rays defeated the White Sox 3-2. (Photo by Jonathan Daniel/Getty Images)
CHICAGO, IL – SEPTEMBER 27: Carlos Pena #23 of the Tampa Bay Rays bats against the Chicago White Sox at U.S. Cellular Field on September 27, 2012 in Chicago, Illinois. The Rays defeated the White Sox 3-2. (Photo by Jonathan Daniel/Getty Images) /

#8: Carlos Pena – 45.52%

Carlos Pena’s career ended in 2014 after just 18 games of a wRC+ of 14. That’s 86% worse than league average. He hadn’t been an above average hitter in over two seasons and was above average just once in the last four years in which he played. His decline came on rather fast going from a 167 wRC+ in 2007 to a 132 in both 2008 and 2009, then a 105 the following season. There was a brief reprise to 133 in 2011.

With a .232/.346/.462 triple slash, 286 HR, 817 BB, and 1577 K, he finished his career with 2650 TTO’s. That’s 3rd most on the list for total Three True Outcomes. His first trip to the postseason was in 2008 where he hit to the tune of a 1.060 OPS to help the Rays advance past the defending champion Red Sox in the ALCS. His second trip was a loss in the division series in 2012, but he did post an 1.126 OPS.

In September of 2015, he signed a one day contract with the Rays so that he could retire as a member of the organization. The former Rays slugger has spent some time as a television analyst since retiring and joined the Red Sox broadcast team in the booth for a series in September of 2017.

Carlos Pena played for 8 teams in his professional career. He debuted with the Texas Rangers then played for the Oakland Athletics, the Tigers, the Red Sox, the Tampa Bay Rays, Chicago Cubs, the Houston Astros and the Kansas City Royals.

BOSTON – OCTOBER 23: Mark Bellhorn of the Boston Red Sox hits a two-run home run in the eighth inning during game one of the 2004 World Series against the St. Louis Cardinals at Fenway Park on October 23, 2004 in Boston, Massachusetts. The Red Sox defeated the Cardinals 11-9. (Photo by Ron Vesely/MLB Photos via Getty Images)
BOSTON – OCTOBER 23: Mark Bellhorn of the Boston Red Sox hits a two-run home run in the eighth inning during game one of the 2004 World Series against the St. Louis Cardinals at Fenway Park on October 23, 2004 in Boston, Massachusetts. The Red Sox defeated the Cardinals 11-9. (Photo by Ron Vesely/MLB Photos via Getty Images) /

#7: Mark Bellhorn – 45.82%

Mark Bellhorn is the second member of this list to have a significant impact on a Red Sox World Series championship. He had an .836 OPS in the 2004 ALCS against the New York Yankees including a 4th inning HR off of Jon Lieber to put the Red Sox up 4-0. That home run would prove to be the game winner. He also had an 8th inning leadoff HR in game 7 to put the Sox up 8-3. It would be one of several nails in the coffin of the Yankees’ playoff run that year.

With a .230/.341/.394 slash, 69 HR, 346 BB, and 723 K, Bellhorn ended his career with 970 TTO’s, the fewest on this list. His 2,117 PA are also the fewest, barely qualifying him for this ranking. Interestingly, he also had the 7th lowest percentage of TTO’s. But that was Bellhorn’s career in a nutshell. He bounced around from team to team serving mostly as a bench player. The only two seasons in which he had a starter’s load of plate appearances were 2004 with the Red Sox and 2002 with the Cubs.

2004 was the only significant playoff appearance of his career. He also earned playoff shares in 2006 with San Diego and 2007 with the Reds, but served exclusively as a defensive replacement for each club.

Mark Bellhorn played for six teams. He began his career in Oakland, then moved on to the Cubs, the Colorado Rockies, the Red Sox, the Yankees, the San Diego Padres, and finally the Cincinnati Reds.

Next: #5/6

DENVER, CO – SEPTEMBER 29: Colorado Rockies first baseman Mark Reynolds #12 hits a two-run home run scoring Trevor Story against the Los Angeles Dodgers in the first inning at Coors Field September 29, 2017. (Photo by Andy Cross/The Denver Post via Getty Images)
DENVER, CO – SEPTEMBER 29: Colorado Rockies first baseman Mark Reynolds #12 hits a two-run home run scoring Trevor Story against the Los Angeles Dodgers in the first inning at Coors Field September 29, 2017. (Photo by Andy Cross/The Denver Post via Getty Images) /

#6: Mark Reynolds – 47.01%

Mark Reynolds is technically still playing, though it is for the AAA affiliate of the Washington Nationals, the Syracuse Chiefs. He could find himself at the major league level if Anthony Rendon or Ryan Zimmerman go down with an injury. And after a 2017 season in which he posted a .352 OBP and a 30 HR, he’s a great bit of depth to have stashed away in the minors.

Over his 11 year career to date, he has a .237/.329/.455 triple slash, 281 HR, 661 BB, and 1,806 K. That puts him 2nd on the list for total TTO’s with 2,748. His 1,806 strikeouts are also second most on the list and account for 65.72% of his TTOs. That’s 3rd most on the list behind two players who haven’t appeared yet.

He has gone to the postseason four times, seeing significant time on the field in two of them; 2007 and 2012. He has only been to the LCS once and has never appeared in the World Series. The only series in which he played well was the 2007 NLDS where he managed an .833 OPS. Perhaps he will see a deep postseason run with Nationals this October. The team may be 3rd in the division currently, but are far too talented to miss the playoffs.

Mark Reynolds has played for 7 teams so far, debuting with the Diamondbacks in 2007. His career has taken him to the Baltimore Orioles, the Indians, the Yankees, the Milwaukee Brewers, the St. Louis Cardinals, and the Rockies.

OAKLAND, CA – MAY 05: Chris Davis #19 of the Baltimore Orioles bats against the Oakland Athletics in the top of the fourth inning at the Oakland Alameda Coliseum on May 5, 2018 in Oakland, California. (Photo by Thearon W. Henderson/Getty Images)
OAKLAND, CA – MAY 05: Chris Davis #19 of the Baltimore Orioles bats against the Oakland Athletics in the top of the fourth inning at the Oakland Alameda Coliseum on May 5, 2018 in Oakland, California. (Photo by Thearon W. Henderson/Getty Images) /

#5: Chris Davis – 47.71%

This is another active player, so his position in the rankings could change. That said, Chris Davis is the most extreme strikeout hitter being covered here, with a rate of 67.20% of his TTO’s coming by way of the K. His total TTO’s rank just 5th, which matches his position in these rankings (the only player for whom that is true).

Davis currently has a .244/.326/.484 triple slash with 270 HR, 485 BB, and 1,547 K, totalling 2,302 TTO’s. He has spent the majority of his major league career in Baltimore, having struggled to find his footing in Texas before being traded. His first full season with the Orioles was his breakout year, finishing with an .827 OPS and 33 HR. He has been a staple of the Orioles offense ever since, even signing a 7 year deal for $161M after the 2015 season.

The big lefty slugger has been to the playoffs twice, in 2012 and 2016. He missed the 2014 playoff run that saw the Orioles make it to the ALCS due to a positive test for amphetamines. He has yet to perform well in the postseason managing just a .452 OPS across 7 games.

His playing career has been fairly up and down, even since his breakout. With wRC+’s of 121, 168, 94, 149, 112 and 92 leading into this season, we may be seeing the beginning of the end. His wRC+ for this season is just 45 so far. He leads this list in percentage of TTO’s as strikeouts and is dead last in percentage of walks. If that isn’t a house of cards, I’m not sure what is.

Chris Davis has played for two teams, starting his career in Texas with the Rangers before being traded to the Baltimore Orioles in 2011.

Next: #3/4

DENVER, CO – SEPTEMBER 30: Chris Carter #33 of the Milwaukee Brewers doubles against the Colorado Rockies during a game at Coors Field on September 30, 2016 in Denver, Colorado. (Photo by Dustin Bradford/Getty Images)
DENVER, CO – SEPTEMBER 30: Chris Carter #33 of the Milwaukee Brewers doubles against the Colorado Rockies during a game at Coors Field on September 30, 2016 in Denver, Colorado. (Photo by Dustin Bradford/Getty Images) /

#4: Chris Carter – 50.33%

Chris Carter is an odd case. His .203/.299/.421 triple slash with 158 HR, 327 BB, 951 K put him 7th on the list of total TTO’s, but the delicate balance of a TTO hitter is hard to maintain. Carter leaned a little too heavy toward strikeouts while not having enough walks. He has the 2nd highest percentage of strikeouts against his total TTO’s on the list, while also having the 2nd lowest percentage of walks.

Like Chris Davis, Chris Carter appears to have seen his decline come on very quickly after a modest period of solid production. Breaking out in 2012 with a 137 wRC+, he followed that with a 112, 125, 105 and a 112 in 2016. He also hit 41 HR in 2016, but struggled to find a contract for the 2017 season. Carter eventually landed with the New York Yankees but played in only 62 games and finished the year with a 73 wRC+. He did not sign with another major league team over the winter.

The 6’4” right handed slugger went to the playoffs just once, an unexpected 2015 run by the Astros where he posted a respectable .929 OPS in 6 games. That included a HR in game 3 of the ALDS to put ahead 4-1. It was an insurance run that helped the Astros hold off the eventual World Series Champions for another day.

Chris Carter has played for 4 teams in his career. He debuted with the Athletics, then moved on to the Astros, Brewers and Yankees before signing a minor league contract with the Angels.

CINCINNATI – JULY 22: Adam Dunn #44 of the Washington Nationals is pictured during the game against the Cincinnati Reds at Great American Ball Park on July 22, 2010 in Cincinnati, Ohio. (Photo by Andy Lyons/Getty Images)
CINCINNATI – JULY 22: Adam Dunn #44 of the Washington Nationals is pictured during the game against the Cincinnati Reds at Great American Ball Park on July 22, 2010 in Cincinnati, Ohio. (Photo by Andy Lyons/Getty Images) /

#3: Adam Dunn – 51.70%

Now we come to the top 3. While Adam Dunn would top the list for total TTO’s at 4,158, a mammoth 1,410 TTO’s ahead of second on the list, his percentage of TTO’s out of his total PA leaves him looking up at the last two names on the list. Dunn finished his career in 2014 with a triple slash of .237/.364/.490 including 462 HR, 1,317 BB, and 2,379 K. He is unquestionably the best hitter on this list.

Dunn likely didn’t do quite enough in his career to sneak into the Hall of Fame, but his case for enshrinement isn’t as crazy as you might think. He has the 141st highest career SLG, 42nd most career walks, 37th most HR, 176th most RBI’s, and the 11th best AB/HR rate. But he comes up short in most measures, failing to reach any of the magic numbers and not hitting any of the HoF trackers that Baseball Reference lists on their player pages.

The lumbering lefty has the second highest rate of walks as a percentage of total TTO’s on this list and the lowest rate of strikeouts. This is likely the driving force behind him having a much longer career and far better season to season numbers than anyone else in the top 10.

Adam Dunn spent the first seven and a half seasons of his career in Cincinnati, then finished 2008 in Arizona. He then played two seasons for the Nationals before signing with the Chicago White Sox and finishing his career in Oakland.

Next: #1/2

MINNEAPOLIS, MN – MAY 23: Jack Cust #29 of the Seattle Mariners hits a two-run home run as Drew Butera #41 of the Minnesota Twins catches during the first inning of their game on May 16, 2011 at Target Field in Minneapolis, Minnesota. (Photo by Hannah Foslien/Getty Images)
MINNEAPOLIS, MN – MAY 23: Jack Cust #29 of the Seattle Mariners hits a two-run home run as Drew Butera #41 of the Minnesota Twins catches during the first inning of their game on May 16, 2011 at Target Field in Minneapolis, Minnesota. (Photo by Hannah Foslien/Getty Images) /

#2: Jack Cust – 53.06%

Jack Cust is what this house of cards approach to hitting looks like more often than not. A brief period of steady and productive play sandwiched between a struggle  to break through and a quick decline.. With only 7.68% his TTO’s being HR, the only reason he makes this list is that he had the highest percentage of walks per TTO. His strikeout percentage was 3rd on the list and his 2,578 PA were second fewest.

His profile was one that allowed him to hang on for 10 major league seasons in 11 years, spending all of 2005 in AAA Sacramento. Cust had a run from 2007-2009 where he hit 26, 33, and 25 HR, but otherwise did not play enough for his power to shine. He played more than 100 games in 4 seasons from 2007-2010 and appeared on Baseball America’s top 100 list 3 times from 2000-2002. Over his 11 years in the majors, he never once appeared in the postseason.

HIs one claim to fame is that he finished his career with the 48th highest career OBP among players with 600 PA or more. This ability to draw a walk was quite impressive and he had enough power to be a dangerous hitter. Unfortunately, his defense was horrendous which made finding teams with room to fit him on their roster was difficult.

Jack Cust played for 6 teams, starting his career with the Arizona Diamondbacks. He spent time with the Rockies, Orioles, Padres, Athletics and the Seattle Mariners. He spent an additional two seasons in AAA for the Yankees and the Toronto Blue Jays but was unable to find his way back to the major league level.

ANAHEIM, CA – JULY 03: DH Russell Branyan #39 of the Los Angeles Angels of Anaheim watches his hit go over the right center field wall for a homerun during their MLB game against the Los Angeles Dodgers at Angel Stadium of Anaheim on July 3, 2011 in Anaheim, California. The Angels defeated the Dodgers 3-1. (Photo by Victor Decolongon/Getty Images)
ANAHEIM, CA – JULY 03: DH Russell Branyan #39 of the Los Angeles Angels of Anaheim watches his hit go over the right center field wall for a homerun during their MLB game against the Los Angeles Dodgers at Angel Stadium of Anaheim on July 3, 2011 in Anaheim, California. The Angels defeated the Dodgers 3-1. (Photo by Victor Decolongon/Getty Images) /

#1: Russell Branyan – 61.89%

Russell Branyan played over 14 seasons from 1998-2011. His .232/.329/.485 slash, 194 HR, 403 BB, and 1,118 K leave him with 1,715 TTO’s. That’s good for 6th most on this list. But since we are looking for the hitters who were the most prolific TTO hitters by percentage, and not the ones with the most total TTO’s, the former journeyman takes the top spot. He also holds the distinction of playing for the most teams, coming in at 10!

More from Call to the Pen

Struggling to find regular playing time, he appeared in 100 games just 4 times in his 14 year career. He appeared in 75 or fewer in 7 of them. Despite the length of his career, he appeared in just 6 playoff games amassing a .732 OPS. His high watermark for HR was 31 in 2009 with the Mariners and reached 20 in just 3 other seasons.

After spending 2012 in the Yankees farm system trying to crack the major league roster again, he moved to Mexico to play in the Caribbean League. He managed to hit 52% better than league average. He played most of 2014 in Mexico as well and appeared in 4 games for the Indians’ AAA affiliate before finally hanging up the cleats.

Russell Branyan played for the Indians, Reds, Brewers, Rays, Padres, the Philadelphia Phillies, the Cardinals, Mariners, Diamondbacks and the Los Angeles Dodgers.

Next: London not realistic expansion destination for MLB

What Three True Outcomes hitters can you remember rooting for? Which ones who are playing now do you think might have a chance to crack this list? Let us know in the comments!
Next