Mookie Betts, Mike Trout lead charge for ‘on pace for’ versus ‘projected for’ statistics

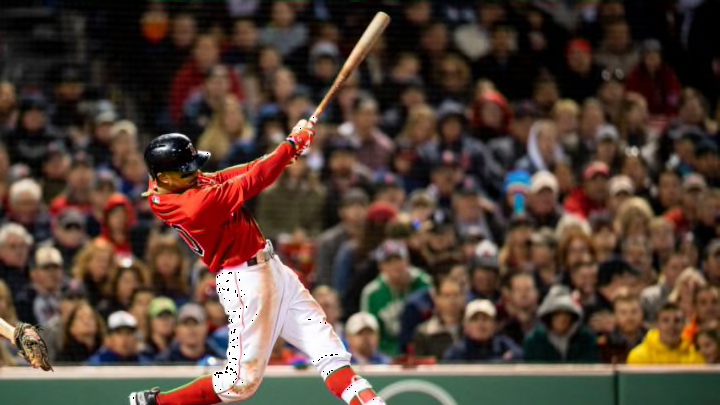
BOSTON, MA - MAY 18: Mookie Betts #50 of the Boston Red Sox hits an RBI double during the sixth inning of a game against the Baltimore Orioles on May 18, 2018 at Fenway Park in Boston, Massachusetts. (Photo by Billie Weiss/Boston Red Sox/Getty Images)
3 of 3
Next
BOSTON, MA – MAY 18: Mookie Betts #50 of the Boston Red Sox hits an RBI double during the sixth inning of a game against the Baltimore Orioles on May 18, 2018 at Fenway Park in Boston, Massachusetts. (Photo by Billie Weiss/Boston Red Sox/Getty Images)
BOSTON, MA – MAY 18: Mookie Betts #50 of the Boston Red Sox hits an RBI double during the sixth inning of a game against the Baltimore Orioles on May 18, 2018 at Fenway Park in Boston, Massachusetts. (Photo by Billie Weiss/Boston Red Sox/Getty Images) /

It’s easy to use simple multiplication to create “on pace for” statistics, especially with the hot starts of Mookie Betts and Mike Trout. But a better way is combining current stats with projections.

For some baseball fans, part of their enjoyment of the game is the statistics the players put up. We like to see guys score 100 runs in a season or hit 30 homers or plate 100 RBI, such as Mookie Betts and Mike Trout. Twenty wins by a starting pitcher was the standard for decades. It’s no longer a number that many starters reach in a season, but the reverence for a 20-game winner still lingers.

At certain points of the season, it’s easy to calculate what a player might do over the entire season. When teams have played around 40 games, we can easily multiply by four to get an “on pace for” total. Mookie Betts was on pace for 52 home runs through the first quarter of the season. His teammate, J.D. Martinez, was on pace for 132 RBI.

Now that we’re roughly one-third of the way through the season, we can easily multiply by three to get a player’s “on pace for” total. Using this method, Mike Trout is on pace for 54 home runs. Mookie Betts is on pace for 156 runs scored. Manny Machado is on pace for 132 RBI. Perhaps the most surprising “on pace for” is Ender Inciarte being on pace for 54 stolen bases. His career high is 22.

Then there are the pitchers. Six pitchers are on pace for 21 or more wins. There were no 20-game winners last season, three in 2016, and two in 2015, so six 20-game winners would be quite surprising. The last time baseball had six 20-game winners was in 2002, back when Bartolo Colon was just a wee lad of 29 (and one of the six 20-game winners that year).

Current projectins for Mookie Betts, Mike Trout, and others.

So now’s the part where I pour water all over those numbers. I’ll be Debbie Downer, Gloomy Gus, Mopey Marvin (is that a thing?). As fun as it is to multiply by some number to come up with “on pace for” totals, it’s not the best way. The best way is less fun, less exciting, less noteworthy. The right way is more sensible and pragmatic.

The right way is to combine a player’s current stats with his projected stats going forward using one of the projection sources that are out there (ZiPS, Steamer, The Bat, PECOTA, etc.). Players who are off to great starts will cool down.

Players who start slowly will get better (if allowed to continue to play). That’s how baseball works. Extreme performances, both good and bad, tend to regress to the middle.

Let’s look at some examples using these player’s current stats and their projected rest-of-season stats from the Fangraphs Depth Charts.

The “on pace for” method of simply multiplying by three has seven players on pace to hit 45 or more home runs. These players are:

Using the “rest-of-season projections” method of combining their current stats with their Fangraphs Depth Charts rest-of-season projection gives us the following home run totals for these seven players:

  • 45—Mike Trout
  • 45—J.D. Martinez
  • 42—Joey Gallo
  • 40—Bryce Harper
  • 38—Manny Machado
  • 36—Mookie Betts
  • 31—Jose Ramirez

How about runs scored? Six players are on pace for 120 or more runs scored, led by the aforementioned Mookie Betts:

Things change when you combine their current stats and their projected stats:

  • 124—Mookie Betts
  • 124—Mike Trout
  • 109—Charlie Blackmon
  • 107—George Springer
  • 105—Francisco Lindor
  • 104—Ozzie Albies

Four players are on pace for 120 or more RBI:

But only one of them is projected to get to 120 RBI:

  • 123—J.D. Martinez
  • 110—Manny Machado
  • 106—Javier Baez
  • 105—Freddie Freeman
WASHINGTON, DC – APRIL 14: Starting pitcher Max Scherzer
WASHINGTON, DC – APRIL 14: Starting pitcher Max Scherzer /

How about those six pitchers on pace for 21 or more wins?

It turns out that none of them are projected to reach 20 wins:

  • 19—Max Scherzer
  • 18—Corey Kluber
  • 17—Justin Verlander
  • 16—Luis Severino
  • 15—J.A. Happ
  • 13—Charlie Morton

More from Call to the Pen

One last fun category to look at is pitcher’s strikeouts. We’re in the age of the Three True Outcomes (walks, strikeouts, and home runs). Home runs are slightly down from last year but strikeouts are increasing once again.

Through the first third of the season, there are eight pitchers on pace for at least 250 strikeouts and three of those eight are on pace for at least 300 strikeouts. These eight pitchers and their “on pace for” totals:

Letting sanity prevail, here we have the projected strikeouts for these eight pitchers:

  • 296—Max Scherzer
  • 281—Chris Sale
  • 257—Justin Verlander
  • 241—Gerrit Cole
  • 236—Jacob deGrom
  • 228—James Paxton
  • 214—Trevor Bauer
  • 194—Patrick Corbin

Of course, projections aren’t a magic crystal ball that foretells everything. Players sometimes make adjustments that aren’t accounted for by the projections.

Next: Tony Gwynn: Mr. Padre’s legend and legacy

Sometimes players stay hot for an extended period. We might see one of the players listed above score 140 runs or hit 50 homers or win 20 games. That’s part of the fun of the “on pace for” method, dreaming of the possibilities.
Next