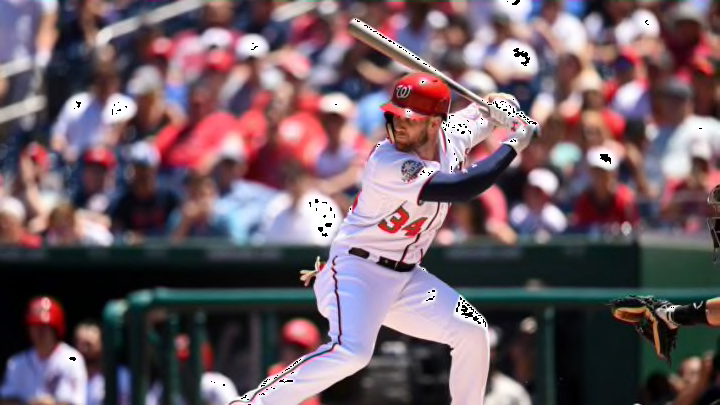
The Participants
Still, there’s a derby to be held so let’s look at the contestants statistically. The first thing to remember with the Home Run Derby is that these are easy pitches to hit. The pitcher grooves a fastball so the hitter can knock it over the fence. So one metric we can use is home runs per balls in play (HR/BIP). To make it more palatable, I’ve figured home runs per 400 balls in play. Here are the contestants, sorted by most HR/400 BIP:
Max Muncy, 56 HR/400 BIP (1st in MLB)
Jesus Aguilar, 51 HR/400 BIP (2nd in MLB)
Bryce Harper, 41 HR/400 BIP (8th in MLB)
Kyle Schwarber, 40 HR/400 BIP (9th in MLB)
Javier Baez, 31 HR/400 BIP (40th in MLB)
Rhys Hoskins, 26 HR/400 BIP (61st in MLB)
Alex Bregman, 25 HR/400 BIP (67th in MLB)
Freddie Freeman, 23 HR/400 BIP (93rd in MLB)
Based on what they’ve done so far this season, Muncy, Aguilar, Harper, and Schwarber are your guys, if you’re the betting sort. Of course, because of the mighty force of regression to the mean, players who hit really well in the first half are likely to come down to earth a bit in the second half (and those who are bad in the first half are likely to improve).
With that in mind, I did some research. Using the rest-of-season depth chart projections from Fangraphs, I figured the projected rate of home runs per 400 balls in play for the Home Run Derby contestants. Here they are, sorted by most HR/400 BIP:
Kyle Schwarber, 39 HR/400 BIP (9th in MLB)
Bryce Harper, 36 HR/400 BIP (8th in MLB)
Rhys Hoskins, 33 HR/400 BIP (61st in MLB)
Jesus Aguilar, 32 HR/400 BIP (2nd in MLB)
Max Muncy, 28 HR/400 BIP (1st in MLB)
Freddie Freeman, 27 HR/400 BIP (93rd in MLB)
Javier Baez, 27 HR/400 BIP (40th in MLB)
Alex Bregman, 22 HR/400 BIP (67th in MLB)
These projections combine what a player has done in the past, with his more recent performance given more weight, to project what he’ll do in the future. Using these rest-of-season projections, Schwarber jumps to the top of the list, with Harper, Hoskins and Aguilar being good bets also. Muncy is more in the middle of the pack. Freeman and Bregman are near the bottom once again.
Finally, let’s look at one last metric. This one is called Barrels per Batted Ball Events Percentage (Brls/BBE%) and it comes from Statcast. This strips out walks, strikeouts and HBP so it just includes when the bat meets the ball and how often those connections result in a Barrel.
From the Statcast glossary: “Created by Tom Tango, the Barrel classification is assigned to batted-ball events whose comparable hit types have led to a minimum .500 batting average and 1.500 slugging percentage.”
Barrels are the best hit balls. They aren’t always home runs, but very often they fly over the wall. Here are the Home Run Derby contestants ranked by Barrels per Batted Ball Events Percentage:
Max Muncy, 19.0%
Kyle Schwarber, 14.4%
Bryce Harper, 13.9%
Javier Baez, 13.1%
Jesus Aguilar, 12.9%
Rhys Hoskins, 11.0%
Freddie Freeman, 11.0%
Alex Bregman, 8.5%
There’s the amazing Max Muncy at the top once again, along with Kyle Schwarber and Bryce Harper. Alex Bregman, who has an interesting strategy, is at the bottom in Barrels. He plans to hit his home runs at a lower angle so they land sooner and he doesn’t have to wait as much time between swings as the guys who hit long, majestic home runs.
Alex Bregman (@ABREG_1) on the unique strategy he'll use in an effort to win the Home Run Derby: "My key is going to be to hit the homers a little bit lower than the other guys, so it lands sooner, so I don't have as much time to wait in between swings." pic.twitter.com/MC9B5HJMzN
— Mark Berman (@MarkBerman_) July 12, 2018
Next: A prediction
