American League Cy Young: A candidate for every style
In the American League Cy Young Award race, there’s a candidate for every style.
American League Cy Young award voters will have their choice of every style of pitcher. If you like workload, Justin Verlander has already piled up 188 innings. If you believe in earned run average, Chris Sale, Trevor Bauer, and Blake Snell all register below 2.25. If you’re an old-school wins person, you’ll be attracted to the 17 victories of Snell, Luis Severino, or Corey Kluber, either (or all) of whom could reach 20 by season’s end. If all-around performance is your thing, Sale or Gerrit Cole may stand out.
New-schoolers can tout the case for Oakland’s Blake Treinen, whose 5.7 Win Probability Added leads the league. More traditional bullpen advocates – if there is such a thing – can point to the 52 saves already compiled by Seattle’s Edwin Diaz.
In short, with a bit more than three weeks remaining in the 2018 season, the contest shapes up to be one of both statistics and styles. That means the eventual winner could be determined by which styles voters prefer as well as by how the candidates fare.
There could be a familiar tint to the voting. Of the top six vote-getters last season five are considered to be viable candidates again this year. Kluber won in 2017 with 28 of 30 first place votes. He did so on the basis of clear advantages in WAR and ERA, two categories that have tended in recent seasons to be bellwethers. While he could repeat, the competition appears to be much closer this season.
For the record, here are the top six from 2017: 1. Kluber; 2. Sale; 3. Severino; 4. Carlos Carrasco; 5. Verlander; 5. Kimbrel.
Here’s a closer look at the cases for and against the leading candidates for the 2018 award.

Trevor Bauer, Cleveland Indians
Old-school stats: 12-6, 2.22 ERA in 25 starts, 166 innings
New-school stats: 5.6 WAR, 3.2 Win Probability Added, 3.2 Situational Wins Saved, 37 Adjusted Pitching Runs
The case for Bauer: Bauer’s 37 Adjusted Pitching Runs trails only Sale. He has allowed just 8 home runs, the fewest per 9 innings of work of any AL pitcher. He also ranks fourth in strikeouts and third in pitcher WAR. Left-handers are batting just .199 against Bauer. He’s improved down the stretch, allowing just a .190 batting average during the season’s second half, and he is undefeated since June. Bauer is at his best under pressure; opponents are batting just .176 against him when the Indians score two or fewer runs. He kills the other guy’s cleanup hitter, holding them to a .186 batting average.
The case against Bauer: He can be gotten early. When opponents swing at Bauer’s first pitch, they hit .291 and slug .516. He’s also injured right now, potentially limiting his ability to build on his award credentials down the stretch. As good as Bauer has been, his 25 starts to date is not taxing in comparison with the league leaders. Finally there’s the matter of Cleveland’s dominance of the weak AL Central, a factor that works against any Indian award candidate. Bauer is 11-3 against the AL Central, but 1-3 against the rest of the world.

Gerrit Cole, Houston Astros
Old-school stats: 13-5, 2.86 ERA in 28 starts, 176 innings
New-school stats: 4.2 WAR, 3.0 Situational Wins Saved
The case for Cole: Cole is a compromise candidate. He doesn’t lead AL pitchers in any single category, but he’s top 10 in most. His 28 starts establishes his workhorse credentials, and his 1.026 WHIP is excellent for a starter. Old-schoolers will love this: Unlike many pitchers, Cole does not noticeably weaken as the game proceeds. From pitch 76 on, his batting average against is just .224. He also knows how to bear down in game-decisive situations. With two out and runners in scoring position, Cole’s batting average against is .158. If Cole gets into a two-strike count, the batting against him is an almost invisible .115.
The case against Cole: His aura of dominance has plainly eroded as the season has worn on. Cole was 10-2 with a 2.52 ERA at mid-season; he’s 3-3 with a 3.75 in the second half. Like many pitchers, he can be gotten to early in the count. On first pitches, or when the first pitch is a ball, opponents hit .299 against Cole with a slugging average above .600. Cole’s American League Cy Young candidacy may also be hurt by the fact that his teammate, Verlander, has made more starts and pitched more innings
.
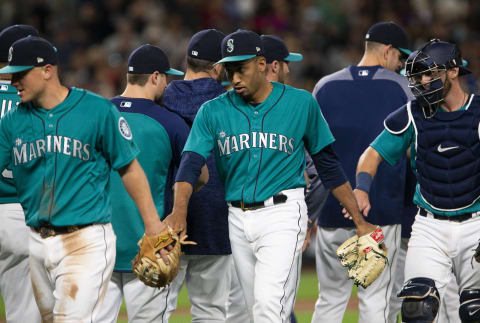
Edwin Diaz, Seattle Mariners
Old-school stats: 0-3, 1.90 ERA, 52 saves in 66 games, 66 innings
New-school stats: 4.5 Win Probability Added
The case for Diaz: Relievers’ save numbers are frequently padded by an abundance of gratuitous, one-inning, 3-run saves. But that is not the case with Diaz. Of his 52 saves, more than half (27) have been of the one-run variety. He has blown four saves, but the Mariners mitigated those rare failures by coming back to win all four games. His .784 WHIP, based on having allowed just 36 hits and 16 walks in 66 innings, ranks among the league’s best. His 212 ERA+ would rank second behind only Sale among American League Cy Young candidates if he had enough innings to qualify. In the late innings of close game – any closer’s speciality – opponents are hitting just .170 against Diaz with a .230 on base average and .236 slugging average.
The case against Diaz: If you believe that relievers ought to have at least a modicum of versatility, Diaz may not be your man. Just three of his 66 appearances have come prior to the 9th inning, and all three were four-out save opportunities. Diaz, in other words, has been a one-trick pony. Granted, his workload has been highly leveraged, but hey, 66 innings is still just 66 innings.
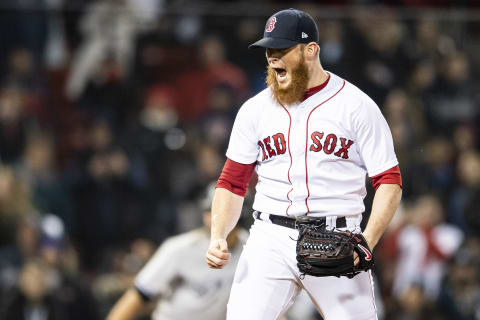
Craig Kimbrel, Boston Red Sox
Old-school stats: 4-1, 2.50 ERA, 37 saves in 54 games, 54 innings.
New-school stats: 2.7 Win Probability Added
The case for Kimbrel: He doesn’t allow hits. Right-handers are batting just .156 against Kimbrel and lefties aren’t doing much better at .165. He stifles the top of the opponent’s order; the other guy’s 1-4 slots are hitting a collective .141 against him. Kimbrel isn’t in trouble even when he’s in trouble. When batters are ahead in the count, they hit just .245 against him, more than 50 points below the league average. In the late innings of close games, opponents’ slash line facing Kimbrell is .163/.280/.304. He’s also a workhorse; on zero days of rest, Kimbrel has allowed just 5 hits in 49 plate appearances.
The case against Kimbrel: Kimbrel has fewer appearances, fewer innings and fewer saves than Diaz. Unlike Diaz, whose resume is laden with one-run saves, he has as many three-run saves as one-run saves (14 of each). Since he and Diaz do the same job, that combination in company with his higher ERA makes it pretty hard to rank Kimbrell ahead of the Seattle closer in the American League Cy Young race. His 1.037 WHIP, while entirely acceptable, is unremarkable for a front-line closer. Finally there’s the matter of Kimbrel vs. the Bronx Bombers. He has faced them four times and has a 7.36 ERA, allowing six of 17 Yankees to reach base.
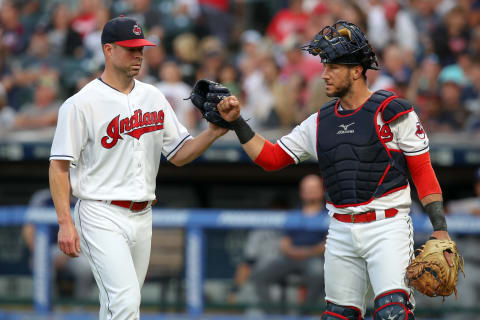
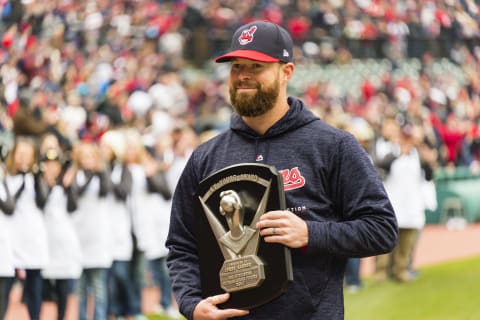
Corey Kluber, Cleveland Indians
Old-school stats: 17-7, 2.80 ERA in 28 starts, 187 innings
New-school stats: 5.4 WAR, 3.1, Win Probability Added, 3.5 Situational Wins Saved, 31 Adjusted Pitching Runs
The case for Kluber: He doesn’t help you beat him. Kluber has allowed just 1.3 walks per 9 innings, the AL’s best in that respect. He ranks fourth in pitcher WAR, fifth in ERA, is tied for first in wins, is fourth in Adjusted ERA+, fourth in Adjusted Pitching Wins and second in Situational Wins Saved. That’s a broad-based credential. With 186 innings of work, he’s hard on the heels of Verlander as the league’s most-used pitcher. He has displayed stamina, holding foes to a .198 batting average the third time through the order. As the defending Cy Young winner and a two-time selection, he also has loads of street cred.
The case against Kluber: His ERA and ERA+ are both off markedly from 2017, 2.80 and 157 compared with 2.25 and 204 when he won the American League Cy Young. His .964 WHIP is also off from his league-leading .869 of 2017, although not as severely. Like his teammate, Bauer, Kluber’s case is damaged by Cleveland’s placement in the AL Central. He’s 8-2 against the weaker divisional opponents, 10-8 against all other competition. Kluber hasn’t been in a large number of binds this season, but he also hasn’t done an especially job of getting out of them. With two outs and runners in scoring position, opponents are batting .326 against him with a .674 slugging average.

Chris Sale, Boston Red Sox
Old-school stats: 12-4, 1.97 ERA in 23 starts, 146 innings
New-school stats: 6.6 WAR, 3.8 Win Probability Added, 3.7 Situational Wins Saved, 38 Adjusted Pitching Runs
The case for Sale: Whether measured by old-school or new-school numbers, he is the stat lover’s poster boy. Sale leads the AL in pitcher WAR, earned run average, strikeouts per 9 innings, hits per 9 innings, Adjusted Pitching Runs, Fielding independent Pitching, Situational Wins Saved and Base-Out Wins Saved. With two out and runners in scoring position, opponents are batting just .073 against Sale, although the value of that stat is modified by the fact that Sale has only faced 43 such situations all year. Sale has faced the Yankees twice and beaten them both times, allowing a total of 9 hits and 1 run. He is to the American Cy Young vote what Susan Lucci was to the daytime Emmys, having finished among the top 6 annually since 2012 without ever winning.
The case against Sale: If Sale loses, it will be due to workload. He has pitched 40 fewer innings than Verlander, he hasn’t pitched in close to a month and he is presently on the disabled list, raising a question about how many more innings he’ll be allowed to accumulate. No starting pitcher in history has won a American League Cy Young Award with as few victories as Sale has right now.
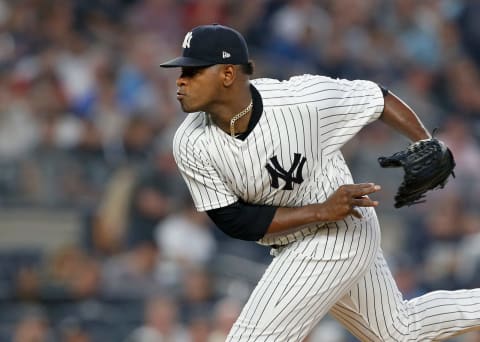
Luis Severino, New York Yankees
Old-school stats: 17-6, 3.32 ERA in 28 starts, 171 innings
New-school stats: 4.4 WAR
The case for Severino: With 17 wins, Severino shares the American League lead and has a good chance to reach 20. His 199 strikeouts ranks 5th in the league. Ahead in the count, he’s nails, allowing just a .174 batting average. Don’t even think about getting to Severino prior to the fifth inning; in the first four, opponents are batting .211 with just 9 home runs. In Fielding Independent Pitching, Severino ranks fifth at 3.06, demonstrating that as long as he’s in the game, he controls it.
The case against Severino: Through July 7, Severino was 14-2; since then he’s 5-4 with losses to the Royals, Mets and Rays. Lately he’s become a “five and fly” guy, having been knocked out prior to the end of the sixth inning in 8 of his last 10 starts. When batters have count leverage, they’re hitting .309 against Severino. In-game stamina is also an issue. From pitch 76 on, opponents are batting .323 against him. Finally, Severino’s success or lack of same correlates with his run support. When the Yanks give him two or fewer runs, the batting average against him is a subpar .279.
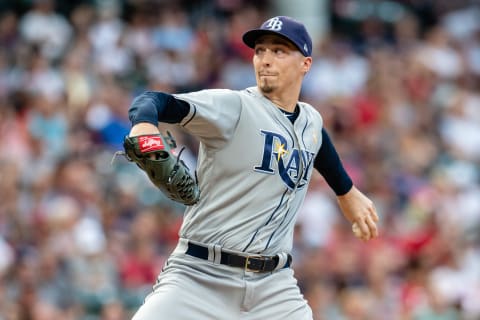
Blake Snell, Tampa Bay Rays
Old-school stats: 17-5, 2.02 ERA in 26 starts, 152 innings
New-school stats: 5.8 WAR, 3.7 Win Probability Added, 2.6 Situational Wins Saved, 36 Adjusted Pitching Runs
The case for Snell: The Rays are 71-63 playing 38 games against the Red Sox and Yankees. There has to be a reason, and Snell’s it. His 17 wins ties for the league lead, he ranks second in ERA and he’s packing a 1.00 WHIP that ranks fifth. With 1`77 Ks, he’s averaging better than one per inning as a starter, and he’s done that while walking just 54. With two out and runners in scoring position, only three batters all season have hit safely against Snell; his OPS in that situation is an almost impenetrable .370. Finally since the trades of Chris Archer and Nathan Eovaldi there’s his unique status as the Rays’ only established starter to consider.
The case against Snell: The new-school stats are not especially kind to him. He is not among the top 10 in Win Probability Added, Situation Wins Saved or Base-Out Runs Saved, and he ranks behind Bauer, Sale and Kluber in Adjusted Pitching Runs. As odd as this sounds, Snell withered against baseball’s worst team, the Orioles. He faced them once, lasted just 3 and one-third innings, and got tapped for five earned runs.
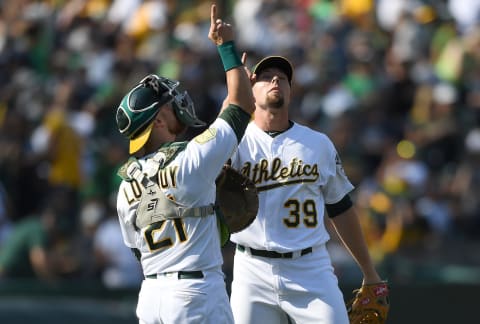
Blake Treinen, Oakland A’s
Old-school stats: 6-2, 0.91 ERA, 36 saves in 59 games, 69 innings
New-school stats: 5.7 Win Probability Added, 2.2 Situational Wins Saved, 24 Adjusted Pitching Runs
The case for Treinen: The American League leader in Win Probability Added isn’t Sale, Kluber, Verlander, Snell or any other volume arm; it’s Treinen, at 5.7. Unlike Diaz and Kimbrel, the other prominent relievers in the mix, Treinen’s profile is versatile. Nearly one-third of his 59 appearances have lasted more than a single inning; he is 5-0 with 8 saves in those extended appearances. In the high-leverage situations that are common to late-inning relievers, opponents are batting .148 against Treinen. He has a .176/.218/.189 slash line when working on zero days of rest, and a .107/.153/.125 slash line against first batters. Consider also his value to the Athletics’ post-season bid. Manager Bob Melvin has had to be both versatile and imaginative with his pitching staff; Treinen’s flexibility has allowed Melvin to do both.
The case against Treinen: If you’re aggressive, you can get to Treinen. Opponents are batting .391 when they swing at his first pitch. As with any reliever, the other criticism relates to workload. Can you equate 69 innings to 190 innings?
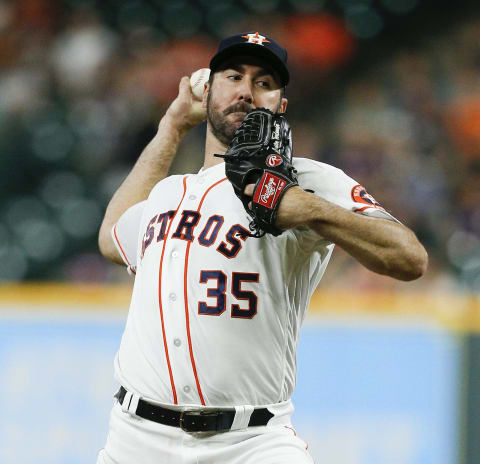
Justin Verlander, Houston Astros
Old-school stats: 14-9, 2.73 ERA in 30 starts, 188 innings, 248 strikeouts
New-school stats: 4.7 WAR, 3.7 Win Probability Added, 2.9 Situational Wins Saved, 29 Adjusted Pitching Runs
The case for Verlander: He leads the American League in starts, innings and also in strikeouts, the latter by a wide margin. He has placed among the top 5 in the Cy Young voting in both of the previous two seasons, so voters are comfortable including him on their ballots. Only Sale (.849) has a better WHIP than Verlander’s .941, and Sale doesn’t approach Verlander’s workload. Through the first five innings, only Severino has been as consistently in Verlander’s league; opponents are hitting just .176 against him in those innings. They’re doing even worse, just .148 with a .233 on base average, leading off an inning. Verlander has made two starts against the Yankees and allowed just one run on eight total hits.
The case against Verlander: With all that workload for a team likely to win its division, Verlander still has just 14 victories. He’s just 5-5 since the All-Star break including losses to Detroit, Texas and the Angels. Notwithstanding his innings total, he’s only made it into the 7th inning twice since July 1.
Next. AL Manager of the Year race. dark
That’s our list of the top contenders for the American League Cy Young as the season winds into its final weeks. Who do you think will win the award? Comment below!