MLB playoffs: Who’s best equipped to handle the October pressure cooker?

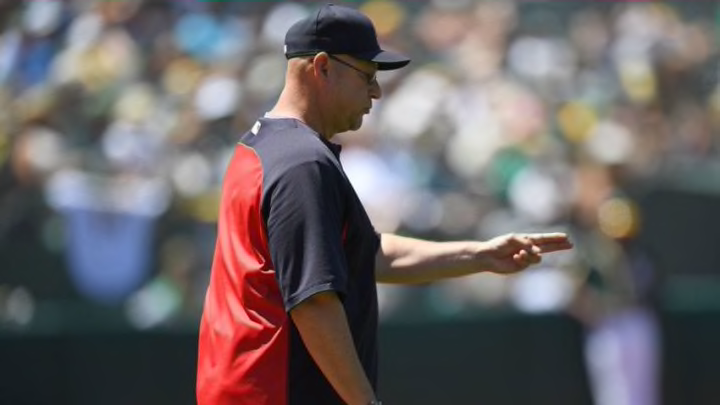
OAKLAND, CA - JUNE 30: Manager Terry Francona #77 of the Cleveland Indians signals the bullpen to make a pitching change against the Oakland Athletics in the bottom of the six inning at Oakland Alameda Coliseum on June 30, 2018 in Oakland, California. (Photo by Thearon W. Henderson/Getty Images)
8 of 14
Next
PHOENIX, AZ – MARCH 30: The bullpen cart drives on the field during a break from the sixth inning of the MLB game between the Arizona Diamondbacks and the Colorado Rockies at Chase Field on March 30, 2018 in Phoenix, Arizona. (Photo by Christian Petersen/Getty Images)
PHOENIX, AZ – MARCH 30: The bullpen cart drives on the field during a break from the sixth inning of the MLB game between the Arizona Diamondbacks and the Colorado Rockies at Chase Field on March 30, 2018 in Phoenix, Arizona. (Photo by Christian Petersen/Getty Images) /

Which potential MLB playoffs teams are best-equipped to win the late innings?

In MLB playoffs baseball, that’s where the outcomes are generally decided. But you already knew that if you watched the 2017 World Series, where 42 percent of the 68 runs produced by the Astros and Dodgers crossed home plate from the seventh inning onward. In three of those decisive seven games, the eventual winning run came home after the sixth inning.

The modern game of baseball, which its hyper-emphasis on bullpens, emphasizes late-inning performance. More than at any time in the game’s history, that emphasis means asking no more than two trips through the batting order out of one’s starter, hoping to establish a lead and holding on for dear life through a succession of pitching changes made possible by bullpens now often running 8 pitchers deep.

But the equation for measuring that late-inning performance hasn’t really changed much: it still comes down to out-scoring one’s opponent. In assessing that postseason prospects of the 13 teams still generally viewed to be in contention for the 10 available MLB playoffs spots, that reduces the questions to four that reflect the relative offensive and defensive abilities of teams in late-game stress:

  1. What is the difference between the number of runs your team scores in a game’s final innings and the number of runs it allows?
  2. Same question, substituting OPS for runs scored?
  3. Same question, substituting OPS in high-leverage situations?
  4. How did the team fare in games that were tied after 6 innings?

What follows is a ranking of the 13 MLB playoffs contenders based on their performance in response to those four questions. For each question, each team is ordered from 1st to 13th, and its final ranking is based on its average ordinal finish. That means a perfect score – reflecting a team that is prismatically fortified to handle late-inning pressure – would be 1.00. The opposite, reflecting a team poorly responding to late-inning pressure – at least by the average of the 13 playoff contenders – would be 13.00.

What could go wrong with such a ranking system? Plenty, but most obviously these two things: First, the postseason isn’t the regular season…it’s far more pressurized. Second, any postseason series of one, five or seven games is a poster-child for the whims of small sample size. Keeping that in mind, here’s the order of teams best-prepared to handle the pressures of late-inning MLB playoffs play, based on their regular season performance to date:

KANSAS CITY, MO – AUGUST 24: Cleveland Indians relief pitcher Andrew Miller (24) during the MLB game against the Kansas City Royals on August 24, 2018 at Kauffman Stadium in Kansas City, Missouri. (Photo by William Purnell/Icon Sportswire via Getty Images)
KANSAS CITY, MO – AUGUST 24: Cleveland Indians relief pitcher Andrew Miller (24) during the MLB game against the Kansas City Royals on August 24, 2018 at Kauffman Stadium in Kansas City, Missouri. (Photo by William Purnell/Icon Sportswire via Getty Images) /

13. Cleveland Indians

The Indians have already clinched a post-season berth and are close to locking up the AL Central. But as has been pointed out elsewhere, that has less to do with the Indians’ general superiority than with the weakness of the AL Central.

Cleveland has had 30 comeback wins to date this season, but the Indians have had an equal number of blown leads. Looking at the late-inning data, Cleveland appears very vulnerable in a series against any MLB playoffs opponent. The Indians have allowed a dozen more runs than they’ve scored from the 7th inning on – 200 compared with 188.

They’ve been out-scored by a dozen runs in both the 7th and 9th innings this season, and they’ve also been out-scored (by 10 runs, the most of any potential playoff team) in extra innings.

The .754 late-inning OPS piled up by Indians opponents is the highest of any of the MLB playoffs contenders by a large measure; Colorado is next at .732. The Indians partially offset that with their own .742 OPS – midpack for playoff hopefuls.

In high-leverage situations overall, the Indians pitching staff has been dreadful, yielding a .791 OPS that is again worst among potential playoff teams, and not be a little. The next worst, the Yankees, are .741, a difference of 50 percentage points  The Cleveland offense’s high-leverage OPS is .765, good but still 25 percentage points behind what the team’s pitchers are yielding. That means that in critical post-season situations, Indians pitchers can be expected to yield plenty of fireworks.

There are fundamental reasons why their winning percentage in games tied after six innings is a stunningly dark .295.

The ordinals for Cleveland are: runs, 10th; OPS, 10th; high-leverage, 12th; winning percentage in ties, 13th. . The average is 11.25.

ST. LOUIS, MO – AUGUST 31: Jordan Hicks #49 of the St. Louis Cardinals pitches against the Cincinnati Reds in the eighth inning at Busch Stadium on August 31, 2018 in St. Louis, Missouri. (Photo by Dilip Vishwanat/Getty Images)
ST. LOUIS, MO – AUGUST 31: Jordan Hicks #49 of the St. Louis Cardinals pitches against the Cincinnati Reds in the eighth inning at Busch Stadium on August 31, 2018 in St. Louis, Missouri. (Photo by Dilip Vishwanat/Getty Images) /

12. St. Louis Cardinals

Opponents have a .729 OPS against St. Louis this season, 29 percentage points better than the Cardinals’ own .700 OPS. Not surprisingly, then, the Cardinals have also been out-scored down the stretch by 16 runs, 205-189. Fighting through the 7th and 8th innings have been particular issues, the Cardinal pen having allowed 25 more runs this season than the St. Louis offense has produced. Opponents have scored more runs against St. Louis in the 7th (82)  and 8th (81) innings this season than any inning except the 5th (97).

St. Louis has 32 comeback victories to date in 2018, equaling its number of blown leads.

In any post-season series, St. Louis had one advantage, that being its ability to respond in high-leverage situations. In such situations, the Cardinals have a .748 OPS. That’s just 9th best among the playoff contenders, but it compares favorably with the .729 high-leverage OPS mustered by Cardinal opponents.

The Cardinals’ ranks of 12th in late-inning OPS difference, 11th in high-leverage OPS difference and 11th in runs scored difference give them an ordinal average of 11.33, the worst among post-season contenders.

Their .507 winning percentage in games tied after 6 innings is obviously below playoff-level caliber, and it is also below the .529 average for all contenders.

The ordinal ranks for St. Louis are: runs, 11th; OPS, 12th; high-leverage, 11th; winning percentage in ties, 7th. The average is 10.25.

LOS ANGELES, CA – SEPTEMBER 01: Kenley Jansen #74 of the Los Angeles Dodgers points to the sky after getting the save in a 3-2 win over the Arizona Diamondbacks at Dodger Stadium on September 1, 2018 in Los Angeles, California. (Photo by John McCoy/Getty Images)
LOS ANGELES, CA – SEPTEMBER 01: Kenley Jansen #74 of the Los Angeles Dodgers points to the sky after getting the save in a 3-2 win over the Arizona Diamondbacks at Dodger Stadium on September 1, 2018 in Los Angeles, California. (Photo by John McCoy/Getty Images) /

11. Los Angeles Dodgers

The Dodgers have out-scored opponents by 23 runs late in games, although they have been out-scored by eight runs in the 9th inning. Against the wrong team, that could be a pivotal weakness. They have amassed 31 comeback wins, but mostly offset that with 29 blown leads.

Based on OPS, they’ve shown a superior offense in those late innings. LA batters carry a .742 OPS from the 7th inning forward, while their pitchers have allowed opponents just a .694 OPS.

The problem for LA has been the team’s ability to come through in any high-leverage situation. Under those conditions, Dodger pitchers have essentially collapsed, surrendering a .731 OPS. That’s 12th among the 13 post-season contenders, and it’s made worse by the Dodgers’ own .644 high-leverage OPS, about 50 points worse than the next worst contender for clutch performance.

In games that are tied through 6 innings, Los Angeles shows less than a champion’s closing kick. The Dodgers have only a .440 winning percentage in such games, well off the .529 average for all contenders. If it helps the feelings of Dodger fans any – it won’t – they’re also below the average of all contenders in winning games they lead after 6 innings. They do that at an .855 clip; the average of all contenders is .895.

The ordinals for Los Angeles are: runs, 8th; OPS, 7th; high-leverage, 13th; winning percentage in ties, 11th. The average is 9.75.

PHOENIX, AZ – AUGUST 21: Relief pitcher Archie Bradley #25 of the Arizona Diamondbacks during the MLB game against the Los Angeles Angels at Chase Field on August 21, 2018 in Phoenix, Arizona. (Photo by Christian Petersen/Getty Images)
PHOENIX, AZ – AUGUST 21: Relief pitcher Archie Bradley #25 of the Arizona Diamondbacks during the MLB game against the Los Angeles Angels at Chase Field on August 21, 2018 in Phoenix, Arizona. (Photo by Christian Petersen/Getty Images) /

10. Arizona Diamondbacks

The apparent collapse down the stretch of the D-Backs’ bullpen muddies the equation since the full-season numbers continue to portray Arizona as a decent, if not great, late-inning team. If they continue on a path to miss the MLB playoffs, none of this will matter. But for the record…:

The Diamondbacks have out-scored opponents by 15 runs from the7th inning on, placing them squarely midpack in that category. Although their 8th and 9th inning numbers have turned modestly negative in recent days, their dominance of the 7th inning – they’re out-scored opponents 69-48 – is preventing a full-out slide.

Having said that, they’ve also blown 36 leads in 2018 compared with just 27 comeback wins.

The Diamondbacks are also average at best in the other categories. Their .685 late-inning OPS is better, although not dominantly so, than the .658 they’ve allowed. In high-leverage situations, they’ve produced a .753 OPS and yielded a .697, both again mid-pack. Although it hasn’t seemed like it lately, the full-season composite picture is of an average-performing MLB playoffs contender through the late innings.

Arizona has just a .440 winning percentage in games that are tied through the 6th inning, good – if that’s the proper word – for a tie with Los Angeles.

The ordinals for Arizona are: runs, 9th; OPS, 9th; high-leverage, 8th; winning percentage in ties, 11th. The average is 9.25.

WASHINGTON, DC – AUGUST 23: Pat Neshek #93 of the Philadelphia Phillies pitches in the ninth inning against the Washington Nationals at Nationals Park on August 23, 2018 in Washington, DC. (Photo by Patrick McDermott/Getty Images)
WASHINGTON, DC – AUGUST 23: Pat Neshek #93 of the Philadelphia Phillies pitches in the ninth inning against the Washington Nationals at Nationals Park on August 23, 2018 in Washington, DC. (Photo by Patrick McDermott/Getty Images) /

T-8. Philadelphia Phillies

Phillies pitchers have allowed 188 runs from the 7th inning on this season, but the Phils’ offense has produced only 167. That’s the most pathetic late-inning production by any of the presumed MLB playoffs contenders. It also makes the Phillies one of only four of the contenders to literally have been out-scored in the late stages of their games in 2018. If there’s a surer recipe for post-season failure than being consistently out-scored in the final innings of games, it would be hard to identify.

Neither have the Phils performed especially well in extra base production. The post-sixth inning OPS is .691, third worst among the contenders and 18 percentage points worse than their opponents.  That, too, ranks 11th among the 13 post-season hopefuls.

Despite that, the Phillies have managed to compile 37 comeback victories in 2018 while blowing just 30 leads.

In high-leverage situations, the Phils do a bit better, producing a .709 OPS that is 47 percentage points better than their opponents’ .662. That .662 mark is the fourth lowest among contenders, but the .047 difference still is only good for 9th best among the 13.In late inning tied games, the Phillies have held their own with a .596 winning percentage.

Philadelphia’s ordinals are: runs, 12th; OPS, 11th; high-leverage,  9th; wins in tied games, 4th.  The average of those ordinals is 9.00, tying the Phils for 8th with…

ATLANTA, GA – AUGUST 19: Wade Davis #71 of the Colorado Rockies celebrates beating the Atlanta Braves with Tony Wolters #14 at SunTrust Park on August 19, 2018 in Atlanta, Georgia. (Photo by Daniel Shirey/Getty Images)
ATLANTA, GA – AUGUST 19: Wade Davis #71 of the Colorado Rockies celebrates beating the Atlanta Braves with Tony Wolters #14 at SunTrust Park on August 19, 2018 in Atlanta, Georgia. (Photo by Daniel Shirey/Getty Images) /

T-8. Colorado Rockies

One would expect Rockies pitchers to yield a lot of late-inning action, and one would hope for Rockies hitters to keep pace. The latter hasn’t happened.

Colorado is the only MLB playoffs contender to have been outscored in the 7th, 8th and 9th innings as well as in extra innings. The 8th has been a particular bugaboo in Denver, Rockies pitchers having allowed 74 runs in that frame and Rockies hitters having produced just 48. From the 7th inning on, the net difference of 51 runs is 30 runs worse than any of the dozen other playoff contenders.

The problem is also reflected in late-inning OPS. Rockies pitchers have allowed opponents a .732 OPS from the 7th inning on, while Colorado batter shave produced a .682 OPS, a 50 percentage point gap.

Despite those flaws, Colorado has magically managed to do quite well in comeback situations. The Rockies have 41 comeback victories in 2018 against just 31 blown leads.

The one saving grace for the Rockies has been the team’s ability to respond to high-leverage situations at any point in the game. Colorado produces a .770 OPS in those circumstances – that’s fourth-best among playoff prospects — while yielding just a .692 OPS.

Philadelphia has been solid in tie-game situations, compiling a .596 winning percentage. It equals the best winning percentage in late ties in the National League and is exceeded only by the Red Sox, Athletics, and Yankees.

The ordinals for Colorado are: runs, 12th; OPS, 11th; high-leverage, 9th; winning percentage in tie games, 4th. The average is 9.00.

MILWAUKEE, WI – SEPTEMBER 03: Josh Hader #71 of the Milwaukee Brewers pitches in the sixth inning against the Chicago Cubs at Miller Park on September 3, 2018 in Milwaukee, Wisconsin. (Photo by Dylan Buell/Getty Images)
MILWAUKEE, WI – SEPTEMBER 03: Josh Hader #71 of the Milwaukee Brewers pitches in the sixth inning against the Chicago Cubs at Miller Park on September 3, 2018 in Milwaukee, Wisconsin. (Photo by Dylan Buell/Getty Images) /

7. Milwaukee Brewers

The Brewers have outscored opponents by 35 runs in the final innings of games, and they’ve been consistent about it, with small double-digit advantages in the 7th, 8th and 9th innings. Their only drawback, obviously a minor one, has been in the infrequent occurrence of extra innings, where they’re been out-scored but just by 18-14.

Milwaukee’s .724 team OPS in late innings is solidly better than the .683 allowed by Brewers pitchers. In all high-leverage situations, Milwaukee hitters have risen to the occasion, producing a .776 OPS that is best among National League MLB playoffs contenders. If nothing else, that alone makes Milwaukee a solid threat to club its way to the World Series.

It also explains Milwaukee’s advantage in comeback wins vs. blown leads, with 37 of the former and 31 of the latter.

There is a downside. The Brewers’ winning percentage in games tied after 6 innings is an uninspiring .507, barely above the average for all of MLB and hardly in keeping with the expectations of contenders. The Crew has partially made up for that with an impressive .228 winning percentage in games in which they trail after 6 innings. For comparison purposes, the average of the 13 contending teams in that category is just .160; only Houston, at .234, is better.

The Milwaukee ordinals are: runs, 7th; OPS, 8th; high-leverage, 6th; performance in late ties, 7th. The average is 7.00.
Chicago Cubs relief pitcher Pedro Strop, left, and catcher Willson Contreras celebrate a 3-2 win against the Washington Nationals at Wrigley Field in Chicago on Friday, Aug. 10, 2018. (John J. Kim/Chicago Tribune/TNS via Getty Images)
Chicago Cubs relief pitcher Pedro Strop, left, and catcher Willson Contreras celebrate a 3-2 win against the Washington Nationals at Wrigley Field in Chicago on Friday, Aug. 10, 2018. (John J. Kim/Chicago Tribune/TNS via Getty Images) /

6. Chicago Cubs

With 44 comeback wins against just 25 blown leads, it’s easy to see why the Cubs cling precariously to the National League’s best record.

The Cubs have the second-largest late inning run differential of any of the MLB playoffs contenders, and they can thank their hitters for that. Chicago has scored 233 runs after the 6th inning, 11 more than any of their fellow National League contenders. Although Chicago’s pen, especially minus closer Brandon Morrow, has had a tendency to send Cubs fans scurrying for the anti-acid tablets, the overall body of work has been good. Cubs pitchers have allowed 163 runs after the 6th inning, fewer than any National League payoff hopeful except Arizona.

A look at the late-inning OPS figures shows why the Cubs have succeeded late in games. They’ve compiled .758 late-inning OPS while allowing opponents just a .654 OPS, a difference of 104 percentage points. Chicago has owned the 7th inning, producing an .829 OPS in that inning compared to its opponents’ .667 and out-scoring teams 105-60. Chicago is one of only two contenders to have produced more than 100 runs in any post-6th inning this season.

The Cubs’ OPS in all high-leverage situations is .697, 31 percentage points better than that of its foes. Compared with other post-season contenders, though; that’s actually a sub-par advantage. The average margin for all 13 putative MLB playoffs teams is 30 points, and only three have a slimmer advantage than Chicago.

Their winning percentage in late ties is .480, a figure not calculated to inspire confidence in the team’s post-season prospects. In 2016, when the Cubs won the World Series, they played .600 ball in games tied after 6 innings.

The Chicago ordinals are: runs, 2nd; OPS, 4th; high-leverage, 10th; winning percentage in tie games, 9th. The average is 6.25.

ATLANTA, GA – JUNE 16: A.J. Minter #33 of the Atlanta Braves and Blooper against the San Diego Padres at SunTrust Park on June 16, 2018, in Atlanta, Georgia. The x won x-x. (Photo by Nic Huey/Beam Imagination/Atlanta Braves/Getty Images)
ATLANTA, GA – JUNE 16: A.J. Minter #33 of the Atlanta Braves and Blooper against the San Diego Padres at SunTrust Park on June 16, 2018, in Atlanta, Georgia. The x won x-x. (Photo by Nic Huey/Beam Imagination/Atlanta Braves/Getty Images) /

5. Atlanta Braves

Atlanta’s profile is consistent and solid if not spectacular, portraying a team capable of steadying its way through the perils of postseason play.

The biggest weakness has been in outcomes. Atlanta has just 29 comeback victories against 32 blown leads.

The Braves have outscored opponents by 42 runs after the 6th inning, and they’ve been particularly strong in the 8th, winning that inning’s battles 91-71. Neither the offense nor mound staff has been spectacular, but both have been reliable. Atlanta batters have a .767 late-inning OPS, while pitchers have allowed just a .679. That gives the Braves nearly a 90 percentage point advantage.

In high-leverage situations, the Braves’ OPS is .755, their opponents have been held to .682. Of the potential MLB playoffs teams, six have a larger differential, but that’s good enough.

In games tied after 6 innings, the Braves have a consummate contenders’ profile. Their winning percentage of .548 is in line with the .529 average for all contenders.

The Braves’ ordinal ranks are: runs 6th; OPS, 6th; high-leverage, 5th; winning percentage in tie games, 5th. The average is 5.50.

BOSTON, MA – SEPTEMBER 7: Roberto Osuna #54 of the Houston Astros reacts after a victory over the Boston Red Sox at Fenway Park on September 7, 2018 in Boston, Massachusetts. (Photo by Adam Glanzman/Getty Images)
BOSTON, MA – SEPTEMBER 7: Roberto Osuna #54 of the Houston Astros reacts after a victory over the Boston Red Sox at Fenway Park on September 7, 2018 in Boston, Massachusetts. (Photo by Adam Glanzman/Getty Images) /

4. Houston Astros

Houston has a 92-run late-inning differential, the best among all contending teams by a spread-eagling 22 runs. The Astros are superior both at scoring and preventing runs down the home stretch of a game. They’ve scored 238 runs after the 6th inning, the highest total in baseball. The 146 they’ve allowed is bettered only by New York …and then only by one run.

That should explain the Astros 36 comeback victories against just 25 blown leads.

If you enter the 8th inning tied with Houston, you’re dead and just don’t know it yet. Astros batters have accounted for 101 runs in the 8th inning alone, while the team’s pitchers have allowed just 47. From the 8th inning on, Houston has outscored opponents 169-106 this season.

The reasons are reflected in the Astros’ OPS numbers. Offensively they’re .770 after the 6th inning, a performance exceeded by just two contenders. Houston pitchers have allowed a .637 OPS after the 6th, again the second best among contenders, and again just a solitary point behind the Yankees.

In high-leverage circumstances, Houston produces a .719 OPS, but yields just a .626, the lowest among MLB playoffs contenders.

The team’s one weakness has been an inexplicable failure in tie games. They have won only 29 of 63 such late ties, a condemnatory .460 winning percentage.  But maybe that isn’t important in Houston; on their way to last year’s World Series victory, the Astros went 25-26 for a .490 percentage in late ties.

Houston’s ordinal ranks are: runs, 1st; OPS, 2nd; high-leverage, 3rd; winning percentage in tie games, 10th. The average is 4.00.

SEATTLE, WA – SEPTEMBER 8: Relief pitcher Dellin Betances #68 of the New York Yankees celebrates after the final out of a game against the Seattle Mariners at Safeco Field on September 8, 2018 in Seattle, Washington. The Yankees won 4-2. (Photo by Stephen Brashear/Getty Images)
SEATTLE, WA – SEPTEMBER 8: Relief pitcher Dellin Betances #68 of the New York Yankees celebrates after the final out of a game against the Seattle Mariners at Safeco Field on September 8, 2018 in Seattle, Washington. The Yankees won 4-2. (Photo by Stephen Brashear/Getty Images) /

3. New York Yankees

Befitting a team winning 6 percent of its games, the Yankees tend to dominate the late innings. They have a 69-run advantage in late-inning production thanks mostly to a staff that has allowed opponents just 145 runs after the 6th inning, the fewest of any potential MLB playoffs team. New York does OK swinging the bats in those situations, too, producing 214 runs. That’s more than all but five other contenders.

Like the Cubs, the Yanks have exercised voodoo-like powers in the 7th inning, scoring 72 runs while allowing just 54. They have 36 comeback wins in 2018 and only 20 blown leads.

The .769 late-inning OPS trails just four fellow contenders, and New York’s problem – a recurring one – is that all four are in the American League.  Its .636 OP allowed is the majors’ best, and the inning-by-inning breakdown is daunting. Against the league-average of .735, here’s the inning-by-inning OPS yielded by the Yankee staff: 7th inning, .707; 8th inning, .625; 9th inning, .556; extra innings, .636.

The Yankees also have a decided advantage in late-inning situations. They have a .798 OPS in those situations, while opponents manage .741, nice but 47 percentage points worse.

In late-inning ties, New York’s .639 winning percentage is exceeded only by the Red Sox and Athletics.

Here are the ordinals for New York: runs, 3rd; OPS, 2nd; high-leverage, 7th; winning percentage in late ties, 3rd. The average is 3.75.

ST. PETERSBURG, FL – AUGUST 26: Boston Red Sox relief pitcher Craig Kimbrel (46) gets set to deliver a pitch during the regular season MLB game between the Boston Red Sox and Tampa Bay Rays on August 26, 2018 at Tropicana Field in St. Petersburg, FL. (Photo by Mark LoMoglio/Icon Sportswire via Getty Images)
ST. PETERSBURG, FL – AUGUST 26: Boston Red Sox relief pitcher Craig Kimbrel (46) gets set to deliver a pitch during the regular season MLB game between the Boston Red Sox and Tampa Bay Rays on August 26, 2018 at Tropicana Field in St. Petersburg, FL. (Photo by Mark LoMoglio/Icon Sportswire via Getty Images) /

2. Boston Red Sox

The Red Sox have outscored opponents by 60 runs after the 6th inning, the 5th widest margin among contenders. In Boston’s case, the reason is its offense, which shrugs off late-inning pressure. Boston has produced 231 runs after the 6th innings, and while that only ranks 4th in production it is just seven runs behind the team leader. The Red Sox have allowed 171.

That’s why Boston has 43 comeback victories in 2018 against just 17 blown leads.

Boston’s 98 percentage point advantage in late-inning OPS is founded on its .773 offensive OPS, the second-best among contending teams. Look out in the 7th inning; the Red Sox have a season-long .833 OPS in that inning. The Red Sox allow only a .670 OPS in the 7th, one reason Boston outscores opponents 98-62 in that inning.

Where Boston is most productive, however, is in high-leverage situations generally. If you are looking for a key to the Red Sox’ 2018 success, this is it. Boston’s team OPS is .882 in such situations, the best among MLB playoffs contenders by more than 80 percentage points. By contrast, opponents manage just a .630 OPS in high-leverage situations against the Red Sox.

In late ties, the Red Sox are the class of baseball, having compiled a .742 winning percentage. No other team is within 50 percentage points of that dominance.

The ordinal ranks for Boston are: runs, 5th; OPS, 5th; high leverage, 1st; winning percentage in late ties, 1st. The average is 3.00.

OAKLAND, CA – SEPTEMBER 07: Jonathan Lucroy #21 and Blake Treinen #39 of the Oakland Athletics celebrate after they beat the Texas Rangers at Oakland Alameda Coliseum on September 7, 2018 in Oakland, California. (Photo by Ezra Shaw/Getty Images)
OAKLAND, CA – SEPTEMBER 07: Jonathan Lucroy #21 and Blake Treinen #39 of the Oakland Athletics celebrate after they beat the Texas Rangers at Oakland Alameda Coliseum on September 7, 2018 in Oakland, California. (Photo by Ezra Shaw/Getty Images) /

1. Oakland Athletics

Yes, Oakland, those funny upstarts in green and gold sit in the throne room in the category of teams least vulnerable to late-inning issues.

How? How do the Athletics accomplish anything? By treating pressure as an amusement, apparently. Oakland has outscored opponents by 69 runs after the 6th inning, equaling New York for the third-best performance among contenders. The A’s have 37 comeback victories but just 25 blown leads.

The A’s offense has been relentless in the late stages of games, producing 232 runs. That’s just six fewer than the Astros and more than any other contender except the Cubs (233).

Oakland’s 151 percentage point advantage over opponents in late-inning OPS is nothing short of a phenomenon. A’s batters are hitting .805 in those situations, the best among all contenders and 32 percentage points ahead of the runner-up Red Sox. Meanwhile, Oakland pitchers have allowed opponents just a .654 late-inning OPS, a shutdown performance exceeded only by the Yankees and Astros.

In high-leverage situations, A’s pitchers are the equal of any. They have allowed just a .636 OPS at those critical moments, hanging tough with Boston (.626) and Houston (.630) and 26 percentage points ahead of everybody else.

In late-inning ties, the A’s smoke everybody except the Red Sox with a .686 winning percentage.

Oakland’s ordinals are: runs, 3rd; OPS, 1st; high-leverage, 2nd; winning percentage in tie games, 2nd. The average is 2.00.

Next. September playoff showdowns. dark

When the MLB playoffs kick off in October, certainly bullpens will factor heavily. What do you think? Do you agree with our bullpen ranks? Comment below!

Next