

MLB Power Rankings: The AL dominates the top of the rankings

The end of the 2018 regular season is upon us (except for two tie-breaker games), so how do the MLB Power Rankings shake out now that all is (almost) said and done?
While we all prepare for an exciting postseason, let’s wrap up the 2018 regular season with some MLB Power Rankings. It was one heck of a season. For starters, there were three teams with 100 or more wins. This is just the seventh time in MLB history this has happened. Big props to the Boston Red Sox (108 wins), Houston Astros (103 wins) and New York Yankees (100 wins). All three teams were in the American League, which is the first time one league had three 100-win teams.
On the other hand, there were also three teams with 100 losses. Whatever the opposite of big props is, that that should be doled out to the Baltimore Orioles (115 losses), Kansas City Royals (104 losses) and Chicago White Sox (100 losses). There have been nine seasons in which three or more teams lost 100 games. The last time this happened was in 2002, when four teams did the trick.
Along with those three 100-loss teams, there were four teams with 95 or more losses. The Cincinnati Reds (95 losses), San Diego Padres (96 losses), Detroit Tigers (98 losses) and Miami Marlins (98 losses) were all just one ugly week from joining the terrible trio who lost 100 or more games. The bottom tier of baseball teams this season had some really bad teams.
With all of the 100-win and 100-loss teams in the American League, there weren’t many middle-of-the-pack teams in the AL. It was truly a league of haves and have-nots. In a surprising twist, the National League had the advantage in interleague play for the first time since 2003. Go figure.
Okay, let’s get to the rankings. These rankings are based on each team’s actual record, run-differential, expected record and how they’ve played since the All-Star break. I’ve included that information with each team in the list below.
MLB Power Rankings: Numbers 30 to 26
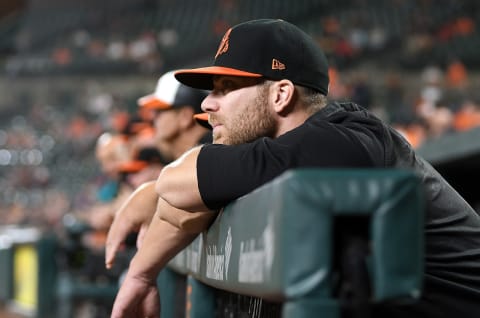
#30 Baltimore Orioles, 47-115 .290 (53-109 Expected Record)
-270 run-differential, 19-46, .292 since All-Star break
The 2018 Baltimore Orioles were the worst team in franchise history, which includes their ugly years as the St. Louis Browns. It wasn’t all the fault of Chris Davis, but he was a major contributor. With a .168/.243/.296 batting line, Davis had the fourth-worst season ever for a player with enough plate appearances to qualify for the batting title (based on Fangraphs WAR). That .168 batting average was the worst ever for a qualifying player and more than 11 points worse than the next two guys on the list, Rob Deer in 1991 and Dan Uggla in 2013, both of whom hit .179.
#29 Miami Marlins, 63-98, .391 (56-105 Expected Record)
-220 run-differential, 22-41, .349 since All-Star break
This season is in the running for one of the five worst seasons the Marlins have ever had and the fans are very aware of it, as they’ve stayed away in droves. The team finished dead last in attendance, averaging just over ten thousand fans per game. That’s just a bit more than some minor league teams. The Orioles lost 17 more games than the Marlins but had nearly double their attendance. Of course, when you trade away last year’s NL MVP in the offseason (Giancarlo Stanton) and the possible NL MVP this year (Christian Yelich), you won’t be winning any popularity contests with your fans.
#28 Kansas City Royals, 58-104, .358 (60-102 Expected Record)
-195 run-differential, 31-36, .463 since All-Star break
Since 2010, the Royals improvement and decline from a last place team to a World Series winner and back to a last place team again would make a nice example of the success cycle. They won 67 games in 2010, then increased their total each year all the way up to a 95-win season in 2015 that culminated in a World Series title. Then they won 81, 80, and 58 games. They’re back at rock bottom. Can Dayton Moore spin his magic a second time?
#27 Chicago White Sox, 62-100 (61-101 Expected Record)
-192 run-differential, 29-38, .433 since All-Star break
A 5-4 loss in their final regular-season game left the White Sox with 100 losses for the first time since 1970. That happens to be the second-to-last season of Hawk Harrelson’s playing career. After his playing days were over, Harrelson moved to the broadcast booth with the Red Sox for six years, then with the White Sox from 1982 to 1985 and again from 1990 until this season. His final game was on September 24, 2018.
#26 Detroit Tigers, 64-98, .395 (62-100 Expected Record)
-166 run-differential, 23-41, .359 since All-Star break
A couple of bright spots during an otherwise down season in Detroit were Nick Castellanos and Jeimer Calendario. They finished one-two on the team in runs scored, home runs, and RBI. On the other hand, Castellanos was possibly the worst fielder in baseball, according to the Fangraphs defensive metric.
MLB Power Rankings: Numbers 25 to 21
#25 San Diego Padres, 66-96, .404 (64-98) Expected Record)
-150 run-differential, 25-38, .413 since All-Star break
According to Fangraphs, the Padres didn’t have a single position player who was league average. The closest was Wil Myers, who had 1.6 WAR in 82 games (2 WAR is league average). Their top pitcher was reliever Craig Stammen, with a 2.77 ERA in 78 innings (2.2 WAR).
#24 Cincinnati Reds, 67-95, .414 (68-94 Expected Record)
-123 run-differential, 24-42, .364 since All-Star break
It was another rough year in Cincinnati. This year’s Reds lost 90 or more games for the fourth straight season. If they lose 90 again next year, they’ll equal the 1930-1934 Reds for the longest stretch of 90-loss seasons in franchise history. This year the Reds had trouble in their own division. They went 26-50 against the NL Central and 41-45 against all other divisions.
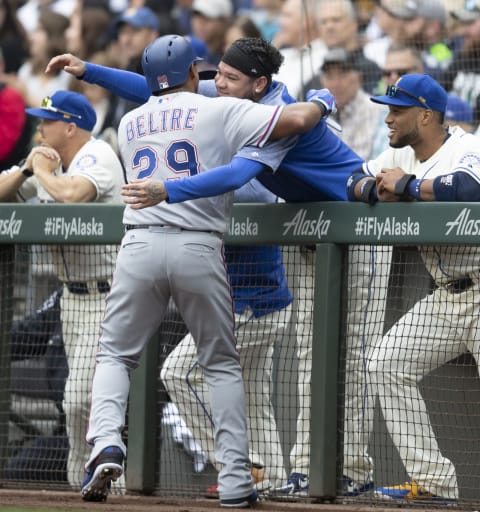
#23 Texas Rangers, 67-95, .414 (70-92 Expected Record)
-111 run-differential, 26-39, .400 since All-Star break
He hasn’t said for sure if he’ll be back next year, but it looked like this might be it for Adrian Beltre based on how he left the game on Sunday afternoon at Safeco Field. If it is the end, he’ll finish his career ranked 16th all-time in hits, 11th in doubles, 30th in home runs and 24th in RBI. Next stop is the Baseball Hall of Fame.
If this is it for Adrián Beltré, its been an amazing ride. #ThankYouBeltre pic.twitter.com/BNxnREHVZI
— MLB (@MLB) September 30, 2018
#22 Toronto Blue Jays, 73-89, .451 (68-94 Expected Record
-123 run-differential, 30-37, .448 since All-Star break
Of the 15 teams in the American League, seven finished with 89 or more wins and five finished with 67 or fewer wins. They were the penthouse teams and the outhouse teams. The three teams in the middle were the Los Angeles Angels (80 wins), Minnesota Twins (78 wins) and Toronto Blue Jays (73 wins).
#21 San Francisco Giants, 73-89, .451 (69-93 Expected Record)
-96 run-differential, 23-41, .359 since All-Star break
The way they finished, it’s easy to forget that the Giants were 50-48 and just four games out of first place in the NL West at the All-Star break. Then they hit .221/.274/.330 in the second half, giving them the worst offense in baseball and the third-worst win-loss record post-break. On the bright side, at least the fans had a nice chance during the final game of the season to show their appreciation for Hunter Pence.
MLB Power Rankings: Number 20 to 16
#20 Philadelphia Phillies, 80-82, .494 (75-87 Expected Record)
-51 run-differential, 27-40, .403 since All-Star break
The Phillies had the third-best record in the National League at the All-Star break, but went 27-40 in the second half. One of the players who struggled most in the second half was Odubel Herrera, who went from hitting .275/.327/.460 before the All-Star break to .216/.282/.346 after.
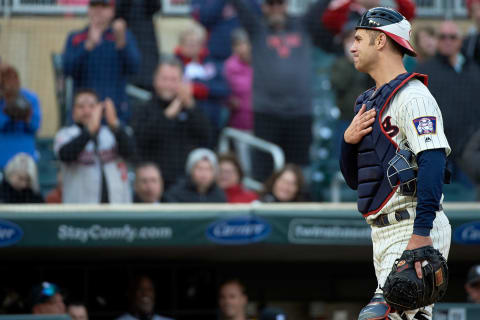
#19 Minnesota Twins, 78-84, .481 (77-85 Expected Record)
-37run-differential, 34-34, .500 since All-Star break
One of the bright spots in a disappointing year for the Twins was catcher Willians Astudillo, who spent most of the year in the minor leagues before getting into 29 games in the bigs. Astudillo was the most unusual hitter in baseball. While the league average strikeout rate was 22.2 percent this year, Astudillo struck out just three times in 97 plate appearances (3.1 percent). Amazingly, he only walked twice (2.1 percent). Here’s hoping he gets a chance to continue his unusual career in the major league next season.
#18 New York Mets, 77-85, .475 (77-85 Expected Record)
-31 run-differential, 38-30, .559 since All-Star break
Christian Yelich had a big final stretch for the playoff-bound Brewers, so many people expect he’ll win the NL MVP Award. By the numbers, though, it should be Jacob deGrom. The Mets hurler led Yelich in Fangraphs and Baseball-Reference WAR and Baseball Prospectus WARP and it wasn’t particularly close. If the Mets hitters had given him some support, he’d be a 20-game winner.
#17 Seattle Mariners, 89-73 (77-85 Expected Record)
-34 run-differential, 31-34, .477 since All-Star break
Mariner fans will be disappointed because the Mariners extended their playoff drought to 17 straight seasons, but the team’s 89 wins this year is their sixth-highest total ever. It’s just that the Mariners were competing for a playoff spot with teams that won 100 and 97 games. One bright spot as the season comes to a close is Edwin Diaz and his 57 saves, tied for second-most ever.
#16 Los Angeles Angels, 80-82, .494 (81-81 Expected Record)
-1 run-differential, 31-34, .477 since All-Star break
As usual, the brightest spot on the Angels this year was center fielder Mike Trout, who should have his seventh straight top-five finish in AL MVP voting. He’ll most likely finish second in the voting for the fourth time. Trout had the highest on-base percentage (.460) and slugging percentage (.630) of his career
MLB Power Rankings: Number 15 to 11
#15 Pittsburgh Pirates, 82-79, .509 (80-81 Expected Record)
-1 run-differential, 34-30, .531 since All-Star break
The excitement of three straight postseason appearances from 2013 to 2015 has worn off for fans in Pittsburgh. Attendance at the best ballpark in baseball, PNC Park, peaked at nearly 2.5 million fans in 2015, when the Pirates won 98 games. Three years later, attendance dropped by more than a million fans as their attendance was at levels last seen in the mid-1990s, when they still played at Three Rivers Stadium.
#14 Arizona Diamondbacks, 82-80, .506 (87-75 Expected Record)
+49 run-differential, 29-36, .446 since All-Star break
Heading into September, the Diamondbacks led the NL West by a game over the Dodgers and 1.5 games over the Rockies. Then they went 8-20 in September and fell out of the race. During this ugly stretch, their bullpen went 2-8, with nine blown saves and a 5.66 ERA.
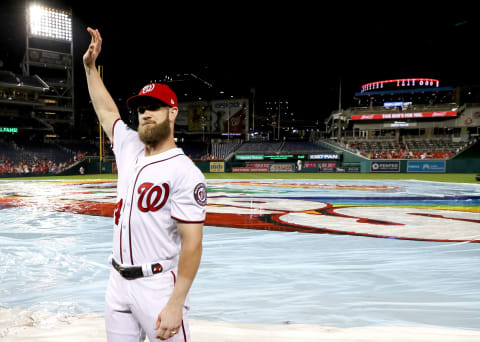
#13 Washington Nationals, 82-80, .506 (91-71 Expected Record)
+89 run-differential, 34-32, .515 since All-Star break
It remains to be seen whether Bryce Harper returns to the Nationals next season, but fans can be happy that Max Scherzer will be back. The Scherz struck out his 300th batter of the season in his final start, which put him in impressive company. As for Harper, after Sunday’s game he had nice things to say about his time in D.C.
"From the first time I stepped foot in that stadium, they had my back ... they were behind me. I can't thank them enough.
— Washington Nationals (@Nationals) October 1, 2018
I love DC and that's what it's all about." - Bryce Harper pic.twitter.com/VB1W0eQGhO
#12 St. Louis Cardinals, 88-74, .543 (89-73 Expected Record)
+68 run-differential, 40-28, .588 since All-Star break
A 1-5 finish to close out the season cost the Cardinals a chance at a playoff spot. Had they gone 4-2, they would be in a tie-breaker playoff on Monday. Instead, they missed the postseason for the third year in a row. The last time the Cardinals weren’t in the playoffs three seasons in a row was from 1997 to 1999, when Mark McGwire was still hitting dingers on a regular basis.
#11 Colorado Rockies, 91-71, .562 (85-77 Expected Record)
+38 run-differential, 40-26, .606 since All-Star break
The Rockies have the second-most wins in franchise history, but it will take a win in their tie-breaker game against the Dodgers on Monday to give them their first NL West division title. When the playoffs begin, the Rockies will have the worst run-differential but the fifth-best second half record of the 10 playoff teams.
MLB Power Rankings: Number 10 to Number 6
#10 Tampa Bay Rays, 90-72 (89-73 Expected Record)
+70 run-differential, 41-25, .621 since All-Star break
In addition to winning an impressive 90 games, the Rays made two in-season trades that should greatly help them in the future. They added outfielder Tommy Pham, who hit .331/.438/.604 in 38 games with the Rays. They also picked up Tyler Glasnow and two minor league players for Chris Archer. Glasnow was about as good as Archer this season and will be cheaper going forward.
#9 Atlanta Braves, 90-72, .556 (93-69 Expected Record)
+102 run-differential, 38-30, .559 since All-Star break
While young position players Ronald Acuńa, Jr. and Ozzie Albies have received much of the attention in Atlanta, the season Mike Foltynewicz had shouldn’t be overlooked. Folty dropped his ERA almost two full runs as he increased his strikeout rate and limited home runs.
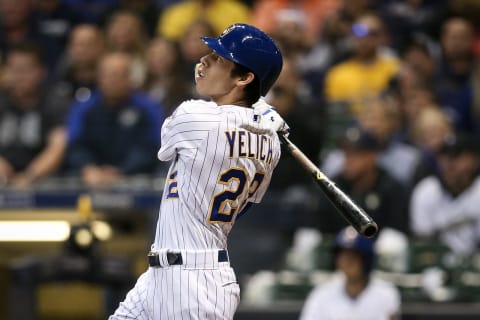
#8 Milwaukee Brewers, 95-67, .586 (92-70 Expected Record)
+93 run-differential, 40-24, .625 since All-Star break
While the Brewers were gunning for a playoff spot by going 20-7 in September, Christian Yelich hit .352/.500/.807, with 24 runs, 10 homers and 33 RBI in 26 games. Yelich has arguably been the best position player in the NL and he has the narrative that voters like, so he will likely win the NL MVP Award, despite not being as valuable as Jacob deGrom according to the assorted Wins Above Replacement metrics.
#7 Chicago Cubs, 95-67, .586 (94-67 Expected Record)
+118 run-differential, 40-29, .580 since All-Star break
The Cubs have won 387 games over the last four years, which is the most wins in a four-year stretch for the franchise since the 1909-1912 Cubs (391 wins). Those were the days when Mordecai “Three Finger” Brown toed the slab in an old stadium called West Side Park. The site where the ballpark stood is now the University of Illinois Medical Center. West Side Park is the only stadium in which the Chicago Cubs have won two World Series. Should this year’s Cubs win the World Series, Wrigley Field would be the second.
#5 Cleveland Indians, 91-71, .562 (100-62 Expected Record)
+170 run-differential, 39-28, .582 since All-Star break
With their third straight postseason appearance this year, Cleveland is in the midst of their best run of playoff seasons since the 1995-1999 team made it five years in a row. Those Cleveland teams went to the World Series in 1995 and 1997 and lost both. This Cleveland team is hoping to get back to the World Series after losing in 2016.
MLB Power Rankings: Number 5 to Number 1
#5 Los Angeles Dodgers, 91-71, .562 (103-59 Expected Record)
+191 run-differential, 38-28, .576 since All-Star break
No team in baseball had a bigger negative difference between their expected record and their actual record. The Dodgers “should” have won 103 games based on their +191 run-differential. Had they done so, they would have coasted to the NL West title and the #1 seed in the playoffs. Instead, they need to win on Monday to avoid the one-and-done wild card game.
#4 Oakland Athletics, 97-65, .599 (96-66 Expected Record)
+139 run-differential, 42-23, .646 since All-Star break
Coming off a four-game losing streak that ended on June 15, the A’s won 12 of their next 14 games on their way to a 63-29 record over their final 92 games. That’s a .685 winning percentage, which would be 111 wins over a full season. That’s really cool and everything, but how about Khris Davis hitting .247 for the FOURTH SEASON IN A ROW?!
Khris Davis batting average the past 4 seasons:
— CBS Sports (@CBSSports) September 30, 2018
2015: .247
2016: .247
2017: 247
2018: .247
At least he's consistent! pic.twitter.com/nTlkPQW4Bv
#3 New York Yankees, 100-62, .617 (100-62 Expected Record)
+182 run-differential, 38-29, .567 since All-Star break
In addition to winning 100 games for the first time since 2009, this year’s Yankees set the MLB record with 267 home runs this season. The old record was 264 by the 1997 Seattle Mariners. Twelve Yankees hit 10 or more dingers, which included six players who blasted 24 or more. Years from now, some curious Yankee fan will look back at this team and think, ‘Austin Romine hit 10 home runs one season?’
More from Call to the Pen
- Philadelphia Phillies, ready for a stretch run, bomb St. Louis Cardinals
- Philadelphia Phillies: The 4 players on the franchise’s Mount Rushmore
- Boston Red Sox fans should be upset over Mookie Betts’ comment
- Analyzing the Boston Red Sox trade for Dave Henderson and Spike Owen
- 2023 MLB postseason likely to have a strange look without Yankees, Red Sox, Cardinals
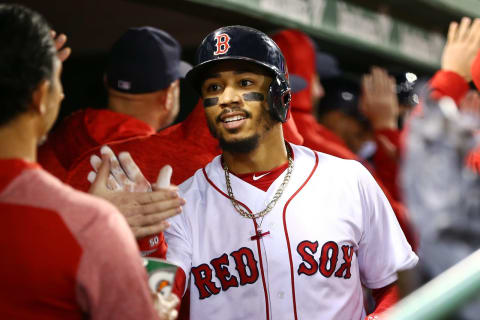
#2 Boston Red Sox, 108-54, .667 (105-57 Expected Record)
+229 run-differential, 40-24, .625 since All-Star break
The Red Sox and Astros are the two best teams in baseball. Whether it should be Red Sox at number one and Astros at number two or vice-versa is a tough call. The Red Sox have more actual wins, but the Astros have a better run-differential and have been very slightly better in the second half. It’s a toss-up. One thing the Red Sox do have is the AL MVP, Mookie Betts.
#1 Houston Astros, 103-59, .636 (112-50 Expected Record)
+263 run-differential, 39-24, .619 since All-Star break
The Astros won 103 games, the most in franchise history, with a run-differential that pegs them as a 112-win team. They did this despite Jose Altuve and George Springer each having their worst seasons in the last three years and Carlos Correa only playing 110 games. The emergence of Alex Bregman was a big part of their success, as was the impressive pitching from Justin Verlander and Gerrit Cole.
Next. 1990s All-Decade team. dark
That’s our final MLB Power Rankings of the 2018 season. So who do you think we have too high going into the postseason? Too low? Comment below!