MLB stats: Are pitches per plate appearance an MLB success key?

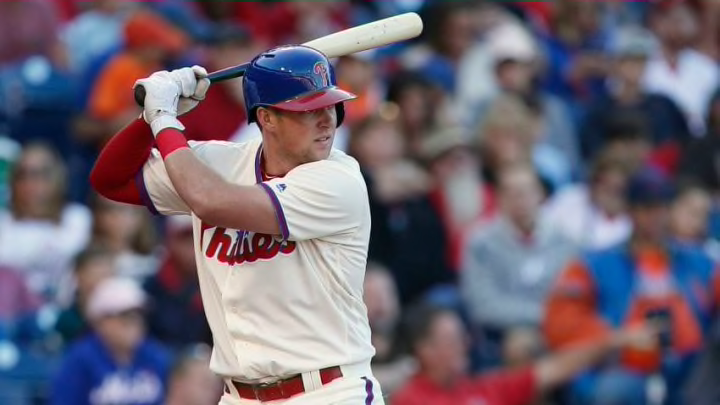
PHILADELPHIA, PA - OCTOBER 01: Rhys Hoskins
1 of 3
Next
BALTIMORE, MD – SEPTEMBER 28: Baltimore Orioles relief pitcher Tanner Scott (66) hands the ball to manager Buck Showalter (26) during the game between the Houston Astros and the Baltimore Orioles on September 28, 2018, at Orioles Park at Camden Yards in Baltimore, MD. The Houston Astros defeated the Baltimore Orioles, 2-1. (Photo by Mark Goldman/Icon Sportswire via Getty Images)
BALTIMORE, MD – SEPTEMBER 28: Baltimore Orioles relief pitcher Tanner Scott (66) hands the ball to manager Buck Showalter (26) during the game between the Houston Astros and the Baltimore Orioles on September 28, 2018, at Orioles Park at Camden Yards in Baltimore, MD. The Houston Astros defeated the Baltimore Orioles, 2-1. (Photo by Mark Goldman/Icon Sportswire via Getty Images) /

Reviewing MLB stats says one of the keys to getting a starter out of the game is pitches per plate appearance. However, with the rise in bullpen usage, is working the count deep really helping hitters and teams as much?

Pitches per plate appearance is a phrase that was rarely heard in baseball 50 years ago, hard as that may be to believe. Today, of course, one of the holy grails of the game is more pitches seen. For decades, however, it was rarely mentioned, not even by coaches, and certainly not before college level ball – if a player made it that far. It was never discussed by broadcasters of MLB games or noted in box scores among other, more notable MLB stats.

Oh, there were surely coaches who chanted “hit your pitch” at batters, and at higher levels of the game, it surely occurred to some their team’s chances would be better if a guy like Bob Gibson left the field. Did any team, however, try to wear out Gibson by making him throw more pitches in their general direction? You tell me.

For 120 to 130 years after professional baseball was born, about as far as thinking about taking pitches went was as follows:

  • Take pitches if you’re the first and/or second batter, so you can report something worthwhile to the other hitters on your team, and…
  • If a pitcher seems wild, make him throw a strike before swinging.

Of course, other things were picked up and acted on, but as general principles went, the points above were “it,” or if there was more, it was certainly kept quiet. A pitch seen for most of the 20th century was a discrete situation involving a ball moving towards a batter whose job was to evaluate the wisdom of swinging at it. The goal, ultimately, was hitting the damned thing. Most of the thinking about it involved doing that – propelling the ball somewhere it couldn’t be fielded. Whether or not it was in the strike zone was an academic point.

In the 21st century, however, more pitches per plate appearance became, in and of itself, an offensive positive. (Baseball-Reference.com started counting pitches seen in 1999.)

But is seeing more pitches per plate appearance actually a good “thing”? And how can we tell?

Baseball involves specific measures of team and individual success. A team making the MLB playoffs is certainly deemed a success, but there are gradations involved there. A one-and-done wild card team is “barely” a success unless it was a dreadful, last-place team the previous year. The team winning the World Series is the “greatest” of team successes no matter where it finished the previous season.
MILWAUKEE, WI – SEPTEMBER 04: Lorenzo Cain #6 of the Milwaukee Brewers jogs to first base after drawing a walk in the third inning against the Chicago Cubs at Miller Park on September 4, 2018 in Milwaukee, Wisconsin. (Photo by Dylan Buell/Getty Images)
MILWAUKEE, WI – SEPTEMBER 04: Lorenzo Cain #6 of the Milwaukee Brewers jogs to first base after drawing a walk in the third inning against the Chicago Cubs at Miller Park on September 4, 2018 in Milwaukee, Wisconsin. (Photo by Dylan Buell/Getty Images) /

Teams and Pitches per Plate Appearance in 2018

Of the 16 teams above the pitches per plate appearance average in 2018 (3.90 P/PA), six made the playoffs. In order from highest number of pitches seen to the lowest, they are the Dodgers (4.05), Yankees, Athletics, Red Sox, Indians and Brewers (3.91). Two of the three best regular season records are represented here by New York and Boston, and one of these teams (Oakland) was a one-and-done wild card team, but a team with far less money to spend than most teams. These are facts arguing that seeing pitches might help push an MLB team to the very top of the sport’s heap.

However, the same chart also says that 10 teams above the seasonal P/PA average did not make the playoffs, and they included the Phillies, the no. 2 team at 4.02. The Phillies suffered a dreadful crash at the end of their season after an extended stretch in first place that reached into August. This list also includes the Padres, for example, a last-place team that ended in a seventh-place tie with 3.93 P/PA. Also above the average are five of the six divisional fourth-place finishers, the White Sox, Angels, Mets, Pirates, and Giants, all sub-.500 teams. Could more aggressive batting approaches have helped these seven teams? We’ll never know.

We do know their games were slower for all those extra pitches taken, however.

We also know that the team with the second lowest P/PA rate (3.80), the Rockies, made the playoffs, and eliminated their wild card opponent. The Rockies know they can swing the bat, and they do.

OAKLAND, CA – AUGUST 17: Evan Gattis #11 of the Houston Astros tosses his bat after drawing a walk against the Oakland Athletics during the sixth inning at the Oakland Coliseum on August 17, 2018 in Oakland, California. The Oakland Athletics defeated the Houston Astros 4-3 in 10 innings. (Photo by Jason O. Watson/Getty Images)
OAKLAND, CA – AUGUST 17: Evan Gattis #11 of the Houston Astros tosses his bat after drawing a walk against the Oakland Athletics during the sixth inning at the Oakland Coliseum on August 17, 2018 in Oakland, California. The Oakland Athletics defeated the Houston Astros 4-3 in 10 innings. (Photo by Jason O. Watson/Getty Images) /

Individuals and Pitches per Plate Appearance This Past Season

Of course, it is silly to ignore individual player success. Indeed, fans often point to a player who had an impressive year when their team failed to make the playoffs. A player who survives at least 10 years at a reasonably high level in MLB can retire at 40 if he wishes to, so individual success related to pitches per plate appearance can’t be forgotten.

The individual at the top of the P/PA heap this past season was Phillies slugger Rhys Hoskins, who saw 4.44 pitches in each of his 661 trips to home plate with a bat in his hand. You don’t even have the do any math here because Baseball-Reference.com has done it for you. Hoskins made NL pitchers throw him 2932 pitches this season (see the second chart linked to the word “six” five paragraphs above).

This player had a very fine first full year in MLB, hitting 34 home runs, driving in 96 runs, becoming the face of the Phillies franchise, and signing with very high profile agent Scott Boras. Barring injury, Hoskins will be a very rich, relatively young man someday. He is 25 now.

What about the rest of the players in the top 25 for pitches per plate appearance, however? All of these players were well above the MLB average, seeing at least 4.18 P/PA.

The discussion could now become very, very complicated, but to simplify at bit, 11 of the 25 leaders in pitches seen played all season with playoff teams. Three more played part of the season with a team making the post-season. One of the three who played a partial season with a post-season team was traded away from that playoff team (Jonathan Villar), but 13 of 25 making it to the playoffs isn’t a bad figure. Arguably, hunting the perfect pitch worked for these players.

But some of these leaders in P/PA may be in the top 25  in part because they’re truly feared hitters who are often pitched around (e.g., Jose Ramirez, no. 2; Mike Trout, no. 3; Giancarlo Stanton, no. 17, 25th on the list).

Also, there are players in the top 25 who are not clearly served as well as Hoskins by a high P/PA such as Kyle Schwarber, who is also 25 years old at this point. Schwarber was in a fifth place tie for most pitches seen this year (4.31) and is now a “lifetime” .228 hitter with an .809 OPS. He hits home runs and walks. For a left fielder he doesn’t drive in that many runs – he picked up 1.97 RBI for each of his 30 home runs in 2017, and 2.35 for each of the 26 he hit this season. He was sent to the minors last season. What may keep him with the Cubs is the fact he is a former no. 4 overall draft pick as much as anything else.

Points like these might be made about Hoskins’ teammate, Cesar Hernandez, who was in ninth place on the P/PA list at 4.27. Hernandez is older than Schwarber, has less power, drove in about as many runs this year, and walked more. His walks jumped up significantly this year, but his batting average fell steeply, and he’s also seen as possibly on his way out the door from his team clubhouse.

Next. Will Mets sign Machado?. dark

So, as hot as the notion of pitches per plate appearance is, and despite a 20-year trend just about straight uphill, seeing more pitches doesn’t clearly predict a team’s success, and only slightly more predicts an individual batter’s success. A “next great trend” in MLB stats may well be figuring out who would do better swinging at good if not perfect, early pitches in the count.

Next