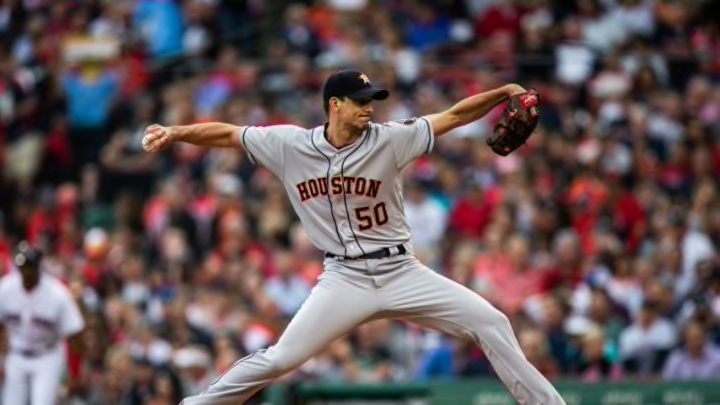
Houston Astros Charlie Morton: MLB’s leading headhunter

Baseball’s Headhunters: The rate is rising
Charlie Morton’s rate of 17.4 HBP/200 IP is a significant jump from the number two guy on the list, Jack Warhop, who pitched for the New York Highlanders and Yankees from 1908 to 1915. Warhop hit 16.1 batters per 200 innings.
Other pitchers at the top of the all-time list for hit batters per 200 innings include Justin Masterson, Jamey Wright, Kerry Wood, Dave Bush and Vicente Padilla. Chris Sale and Johnny Cueto are also high on the list. If many of those names are more recognizable than Jack Warhop, that’s good because they should be. They’ve all pitched this millennium, unlike Warhop, who pitched more than 100 years ago.
There’s a reason the names at the top of the HBP/200 IP list are pitchers who toed the rubber in recent seasons. The number of batters getting beaned has been generally increasing since the early 1980s. Most baseball fans have heard that strikeouts are at an all-time high. The whiff has been increasing every year since 2005, including a record-setting 41,207 strikeouts this season. Well, another record set this season was batters hit.
In 2018, pitchers hit an average of 8.8 batters per 200 IP. That’s a higher rate than the legendary Bob Gibson by a good amount. The average pitcher today hits three more batters per 200 innings than Gibson hit. Before this season, the previous record for HBP/200 IP was set in 2001. Third on the list is the 2004 season. In fact, the top 25 seasons in HBP/200 IP have all come since 1993. We’re in the Golden Age of batter beanings.
Consider the numbers by decade, going back to 1901:
1900s—7.5 HBP/200 IP
1910s—6.1 HBP/200 IP
1920s—4.7 HBP/200 IP
1930s—3.3 HBP/200 IP
1940s—3.0 HBP/200 IP
1950s—4.3 HBP/200 IP
1960s—4.9 HBP/200 IP
1970s—4.3 HBP/200 IP
1980s—4.0 HBP/200 IP
1990s—6.2 HBP/200 IP
2000s—8.1 HBP/200 IP
2010s—7.5 HBP/200 IP
— BobbyBaseball (@bballonthebrain) October 11, 2018
It should be noted that HBP data wasn’t officially recorded before 1920, so the numbers for the 1900s and 1910s have been filled in as best as possible by researchers. After higher rates in the first two decades of the 20th century, hit batters dropped in the 1920s and 1930s before bottoming out in the 1940s. They rose again in the 1950s and 1960s, then dropped in the 1970s and 1980s. The last three decades have been among the highest ever.
Of course, not all pitchers are beaning batters. Let’s take a look a the other guys.