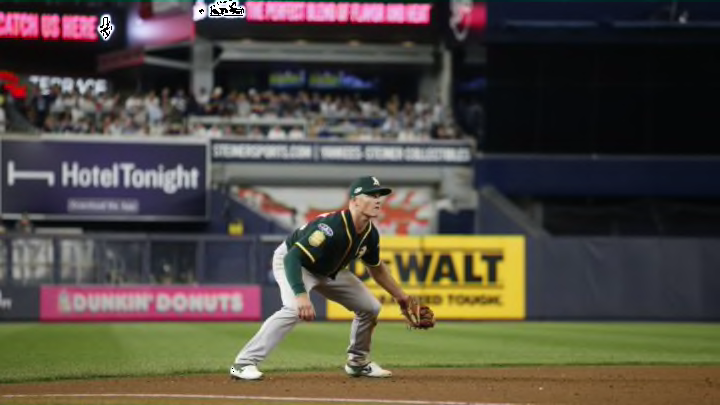
As MLB teams increasingly turn to advanced stats to evaluate player performance, so to do the Baseball Writers’ Association of America (BBWAA) when voting on the Gold Glove awards.
Yesterday, MLB announced the Gold Glove Award winners for each position. In case you just crawled out from under a rock, here are the winners:
First Base
- AL – Matt Olson, Athletics
- NL – Freddie Freeman, Braves
- NL – Anthony Rizzo, Cubs
Second Base
- AL – Ian Kinsler, Red Sox
- NL – DJ LeMahieu, Rockies
Third Base
- AL – Matt Chapman, Athletics
- NL – Nolan Arenado, Rockies
Catcher
- AL – Salvador Perez, Royals
- NL – Yadier Molina, Cardinals
Center Field
- AL – Jackie Bradley Jr., Red Sox
- NL – Ender Inciarte, Braves
Left Field
- AL – Alex Gordon, Royals
- NL – Corey Dickerson, Pirates
Right Field
- AL – Mookie Betts, Red Sox
- NL – Nick Markakis, Braves
Short Stop
- AL – Andrelton Simmons, Angels
- NL – Nick Ahmed, Diamondbacks
Pitchers
- AL – Dallas Keuchel, Astros
- NL – Zach Greinke, Diamondbacks.
Traditionally, players with the highest fielding percentage (FP) have been awarded the gold glove award. Baseball analysts and sabermetricians have long pointed out that FP is a flawed stat, given that it doesn’t take into account the “makeable” plays certain fielders don’t make.
After conducting a brief analysis (SEE BELOW) of the winners, it seems that members of the BBWAA are relying more on advanced stats to determine who deserves the award than ever before.
This year, it seems, voters turned to defensive run saved (DRS) to determine who the best fielders were. Sports Info Solutions defines DRS as:
"DRS is a comprehensive accounting of how a player performs defensively. Depending on the position a player plays, Runs Saved is a combined measure of his range and positioning, his ability to field bunts, to turn double plays, to prevent baserunners from advancing either on balls in play or on stolen base attempts, to get extra strike calls, to limit earned runs, and to make extraordinary defensive plays while avoiding misplays. Positive numbers mean that a player saved his team runs, while negative numbers mean a player cost his team runs, with zero being average."
Interested in learning some more about advanced stats, check out this glossary by Benjamin Chase.
CLICK HERE to view advanced fielding stats for the Gold Glove winners.
Here’s what my analysis revealed:
Of the 19 Gold Glove Award winners, 13 (68%) of them ranked top three in DRS at their position. Eight of those rank first in DRS at their position.
There were only two cases in which the top ranked player for a given position in DRS did not receive the award. It happened at the CF and C positions. Lorenzo Cain had the highest DRS of any CF (20) and Mike Zunino had the highest DRS for a C (12)
ALL infield Gold Glove winners – that’s 1B, 2B, 3B, and SS – ranked first in DRS for their respective leagues.
It seems as the game evolves, the BBWAA has evolved alongside it, including Gold Glove awards. Analytics have been here for a while, and its looking like they’re here to stay.
