

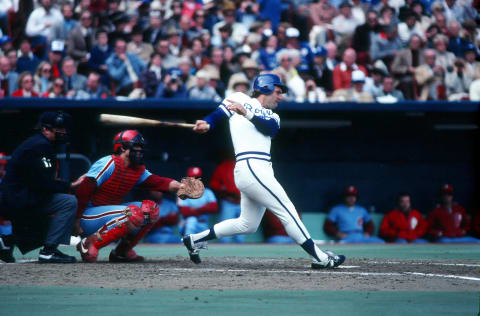
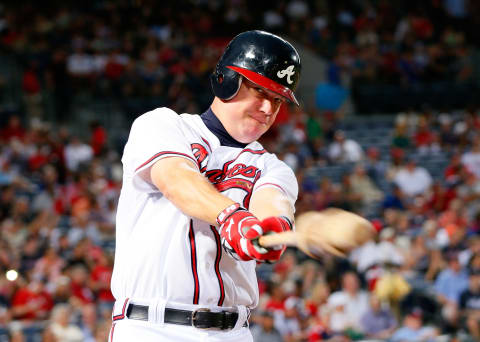
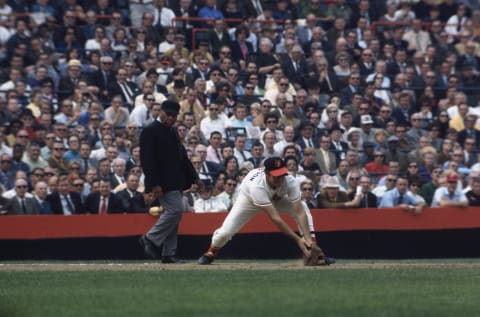
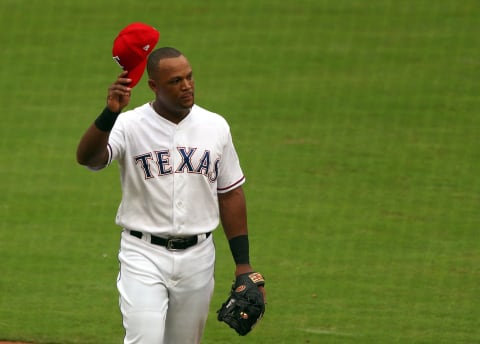
Adrian Beltre’s Hall of Fame credentials
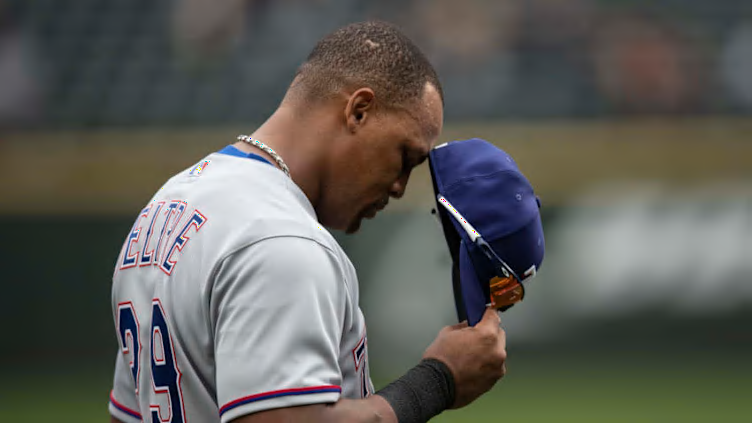
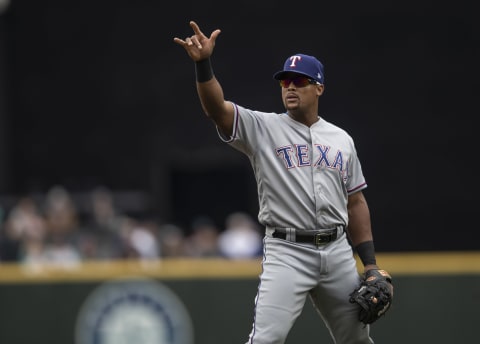
Adrian Beltre has announced his retirement…now it’s time to take his measure for Cooperstown
Adrian Beltre’s announcement that he is retiring touched off an immediate spate of discussion concerning his Hall of Fame qualifications. The consensus: He’s in…possibly on the first ballot.
A deeper look at the statistics behind the argument largely supports that view, although some of those stats leave just enough room for a dedicated naysayer to make an opposing case.
In considering the case for or against any Hall of Fame candidate, the first question is: what are the standards? The Hall offers only general guidelines. But as a general proposition, contemporary voters tend to focus on two “new” stats: Wins Above Replacement (WAR) and Park Adjusted OPS (OPS+).
We’ll look at those, but we’ll also consider some old-time metrics: batting average, home runs and plate appearances. We’ll also look at honors and awards: How many times was the player among the top five finalists in the MVP voting? How often was he selected as an All Star? Finally, for each of those measurements we’ll consider the difference between the player’s career performance and peak performance, which we’ll define as each player’s best five consecutive seasons.
Our field of study will include Beltre as well as the 14 players presently enshrined in Cooperstown whose primary position was third base. For context, we’ll also include five very good third baseman who, despite being eligible, have never mustered Hall of Fame-level support. The five non-Hall of Famers, selected from different eras, are Buddy Bell, Ron Cey, Stan Hack, Ken Boyer and Scott Rolen.
Considering how Beltre fares within that field of 20 ought to give us a pretty good indicator of whether his Hall of Fame candidacy will hold up to voter scrutiny five years from now.
Career bWAR
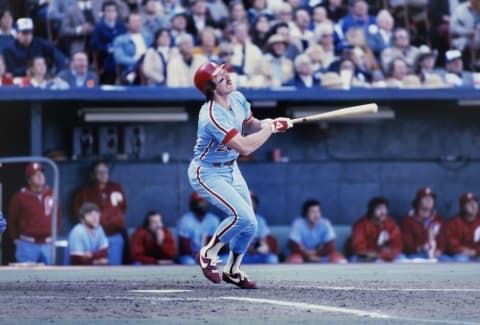
This may be Beltre’s single strongest credential. Across his 21 season career, he compiled a 95.7 career WAR, more than all but two of the players in our comparison. Only Mike Schmidt (106.8), generally recognized as the best third baseman of all time, and Eddie Mathews (96.6) rank ahead of Beltre.
The average of our field of 20 is 67.93, meaning Beltre also ranks way above the norm for the game’s best.
The remarkable thing about Beltre’s career is that he never generated a negative WAR; his career low was 0.2 during a partial 1998 season when he was a teen-ager. As a full-timer, he’s only had one season with WAR below +2.0.
The closest comparables to Beltre are Chipper Jones and Wade Boggs (91.4), both of whom were elected with more than 90 percent of the vote. The Jones comparison is especially meaningful because Chipper was just elected earlier this year. That means that fundamentally the same voting bloc which gave Jones a 97 percent affirmative vote will five seasons from now be considering Beltre’s credentials.
Here’s how Beltre ranks compared with the five best third baseman of all time measured by career WAR:
1. Mike Schmidt 106.8
2. Eddie Mathews 96.6
3. Adrian Beltre 95.7
4. Wade Boggs 91.4
5. George Brett 88.7
Peak bWAR
Beltre’s peak seasons were 2010-14, a five-year period during which he averaged 5.52 WAR. Compared with our field of 20, that is not an especially compelling total. In fact it ranks 12th, slightly below the group average of 5.93.
One of the recurring themes of Beltre’s candidacy is that he is likely to be viewed more favorably by those who value lifetime achievement than by those who look first toward peak dominance. We see that in WAR and we will see it again in several of the other categories.
Not that there’s anything wrong with a 5.52 WAR; a team staffed with 5.52 WAR players would win every pennant in a walk. At the same time, three of the five non Hall of Famers included in or study – Rolen (6.44), Boyer (6.34) and Bell (5.84) had better peak WARS than Beltre.
Fortunately for Beltre, peak value performance may well not be decisive among voters. Jones averaged 6.28 WAR during his 1998-2002 peak seasons. That is better than Beltre, but not a great deal better…and it ranks only 10th among our 20. When voters considered his candidacy this past January, they managed to look past that so-so (by HOF standards) peak WAR.
Here is how Beltre compares with the five best in our survey as measured by peak WAR
1. Wade Boggs 1985-89 8.42
2. Ron Santo 1964-68 8.40
3. Mike Schmidt 1980-84 8.10
4. George Brett 1976-80 7.70
5. Eddie Mathews 1953-577.40
12 Adrian Beltre 2010-14 5.52
Career OPS+
This stat is an offshoot of OPS – on base plus slugging average – with two adjustments. First, it is park-adjusted and season-adjusted, making it excellent for purposes of cross-era comparison. Second, it is scaled to an average of 100, making comparisons among players easy.
In that context, Beltre’s career 116 sounds excellent. Among Hall of Fame third baseman, however, it’s run-of-the-mill. The average for our field of 20 is 122.75, and Beltre ranks only in a tie with non Hall of Famer Boyer for 13th.
He is 31 points behind Mike Schmidt (147), the group leader.
Again, the good news for Beltre is that career OPS+ appears not to be a decisive category among Hall of Fame voters. Two excellent consensus Hall of Famers – Brooks Robinson (104) and Jimmy Collins (113) rank behind him.
The bad news is that the standards may be moving. When Jones was elected, it was with a 141 career OPS+ that ranks third all time and 10 places ahead of Beltre. So if a new breed of voters is looking hard at this new measurement rubric, it could be trouble for Beltre.
Here is how Beltre compares with the five best third basemen of all time as measured by career OPS+:
1. Mike Schmidt 147
2. Eddie Mathews 143
3. Chipper Jones 141
T4 George Brett 135
T4 Home Run Baker 135
T-14 Adrian Beltre 116
Peak OPS+
With an average 138.6 peak OPS+, Beltre is solidly in the middle class of our 20-player field. He stands ninth overall, just above the group average of 137.47.
The best news for Beltre may be this: All eight of the players ahead of him in peak OPS+ are already Hall of Famers.
Jones’ peak average of 152.6, sixth overall, is better than Beltre’s, but not decisively so. Again, Schmidt is the peak leader at 168.
Plate appearances is a significant standard because a player has to be on the field to help his team. At the same time, it is variable, given the differing lengths of seasons.
Still it is worth noting that Beltre ranks second among our 20 third basemen in plate appearances, his 12,130 trailing only Paul Molitor (12,167). When Jones retired, he had 10,614 plate appearances, 1,516 fewer than Beltre.
Here is how Beltre compares with the five best seasons by 3rd basemen all time as measured by peak OPS+:
1. Mike Schmidt 168.0
2. Eddie Mathews 162.0
3. Wade Boggs 158.4
T4 George Brett 153.6
T4 Home Run Baker 153.6
9. Adrian Beltre 138.6
And here is how he compares with the five best careers by 3rd basemen as measured by plate appearances:
1. Paul Molitor 12,167
2. Adrian Beltre 12,130
3. Brooks Robinson 11,782
4. George Brett 11,625
5. Wade Boggs 10.740
Home Runs
Obviously, home runs are a situation-dependent statistic, and that fact obviously will put many great third basemen who played in low-home run eras at a disadvantage.
Still, they can be eye candy for voters, and for that reason they should not be looked past.
Beltre’s 477 career home runs ranks third among our 20, well ahead of the group average of 244. The best comparison is with his essential contemporary, Jones, and it’s a favorable one. Chipper’s Hall of Fame resume includes 468 home runs, nine fewer than Beltre.
For the record, the only third basemen with more home runs than Beltre are Schmidt (548) and Mathews (512).
Beltre also does well when home runs are examined on a basis of peak seasons average. Between 2010-14, he averaged 29 home runs, the fifth best peak performance among our group. This time Jones moves ahead of him, averaging 35.8 home runs at his peak. At 39.4 per season from 1953-57, Mathews leads.
So if you think third basemen are under-represented in Cooperstown, and you also like home runs, Adrian Beltre will get your vote.
Here’s how Beltre compares with the top five third basemen all time as measured by career home runs:
1. Mike Schmdt 548
2. Eddie Mathews 512
3. Adrian Beltre 477
4. Chipper Jones 468
5. Ron Santo 342
And here’s how Beltre compares with the top five third basemen of all time as measured by peak home runs:
1. Eddie Mathews 1953-57 39.4
2. Mike Schmidt 1980-84 36.0
3. Chipper Jones 1998-2002 35.8
4. Ron Santo 1964-68 30.0
5. Adrian Beltre 2010-14 29.0
Batting Average
Due to its era-sensitivity, batting average needs to be considered in context – which, candidly, is why such “new” stats as OPS+ have been developed. Still, it has a sort of legacy status among baseball stats and thus ought not to be blown off entirely.
Beltre’s career .286 mark does not measure up with the category leaders, who for the most part they played during eras when batters were far more batting average conscious.
It does, however, compare nicely with the group average of .290.
Some consensus Hall of Famers do worse. Mike Schmidt had a career .261 average. Eddie Mathews’ career average was .271, and Brooks Robinson managed just .267.
Measured by peak average, Beltre ranks 10th at .316. Again, the category is dominated by third basemen from earlier, more batting average-conscious seasons. Also again, Beltre compares favorably with Jones (.320), and is ahead of Mathews (.300), Robinson (.281) and Schmidt (.280)
Here’s how Beltre compares with the best third basemen of all time for career batting average:
1. Wade Boggs .328
2. Pie Traynor .320
3. Fred Lindstrom .311
4. Deacon White .308
5. Home Run Baker .307
13. Adrian Beltre .286
Here’s how Beltre compares with the best third basemen of all time for five season peak batting average:
1. Deacon White 1882-86 .362
2. Wade Boggs 1985-89 .357
3. Pie Traynor 1928-32 .336
4. Fred Lindstrom 1927-31 .333
5. George Brett 1976-80 .330
10. Adrian Beltre 2010-14 .316
Awards and honors
Among the 20 third basemen used for this analysis, five peaked in an era before there was such a thing as an All Star game. Among the remaining 15, this category will not help Beltre. He was named to four All Star teams, a slim total when compared with the remaining 15. Jones, for comparison, made seven All Star teams.
Beltre did better among MVP voters, twice being named among the top five. He ranked second behind Barry Bonds in 2004, when he batted .334 with 48 home runs and 121 RBIs. In 2012 he was third behind Miguel Cabrera and Mike Trout based on his .321 average, 36 homers and 102 RBIs.
A top five placement in the MVP award vote is probably the toughest criteria we’ve looked at. Only two of our 20 players did it as many as five times. They were Brooks Robinson, the 1964 MVP, and Mike Schmidt, the MVP in 1980, 1981 and 1986. Two played prior to the MVP era, but of the remaining 18 four never were voted among the top five and four others only achieved that distinction once in their careers.
There are some good names among those eight more-deprived MVP finalists, including Boggs, whose fourth in 1985 was the best finish of his career.
Here is how Beltre compares with the best third basemen of all time for All Star appearances:
1. Brooks Robinson 15
2. George Brett 13
T3. Mike Schmidt 12
T3. Wade Boggs 12
5. George Kell 10
T-14. Adrian Beltre 4
And here is how he compares when measured by top 5 MVP votes:
T1 Mike Schmidt 5
T1 Brooks Robinson 5
3. George Brett 4
4. George Kell 3
5. 6, including Beltre, tied 2
In the end…
We’ve measured Beltre against Hall of Famers (and some non Hall of Famers) in 11 categories that could influence the judgment of voters. Obviously, not all categories carry equal weight; nor for that matter can it be assumed that voters will consider only these 11 categories.
More from Call to the Pen
- Philadelphia Phillies, ready for a stretch run, bomb St. Louis Cardinals
- Philadelphia Phillies: The 4 players on the franchise’s Mount Rushmore
- Boston Red Sox fans should be upset over Mookie Betts’ comment
- Analyzing the Boston Red Sox trade for Dave Henderson and Spike Owen
- 2023 MLB postseason likely to have a strange look without Yankees, Red Sox, Cardinals
Still, it’s worth noting that Beltre’s average placing among the 20 greats in these 11 categories was a fraction higher than eighth. He ranked among the top five in career WAR, career home runs, peak home runs, plate appearances and MVP votes.
He did have four placings among the lower half of our group, those being in peak WAR, career OPS+, career batting average, All Star appearances.
More significantly, Beltre’s numbers compare reasonably with those of Chipper Jones, who was only recently inducted at the same position. Jones did win seven of the 11 categories, Beltre just three with one tie… but the margins were rarely substantial.
It’s also worth keeping in mind that Jones got 97 percent of the vote. Given the 75 percent standard for election, Beltre doesn’t have to be Jones’ equal; he just has to be a reasonable facsimile of Chipper. He is that.
Next. Beltre announces retirement. dark
The conclusion: Adrian Beltre is likely to win election, and he has a good chance to do so on the first ballot.