NL East crown: Phillies vs. New York Mets

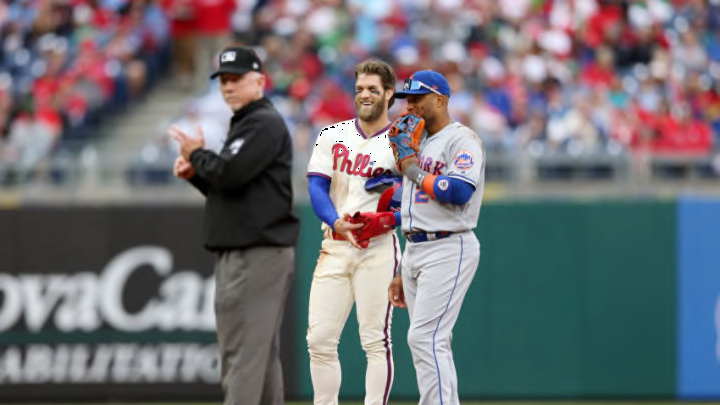
PHILADELPHIA, PA - APRIL 17: Bryce Harper #3 of the Philadelphia Phillies jokes with Robinson Cano #24 of the New York Mets during the game at Citizens Bank Park on Wednesday, April 17, 2019 in Philadelphia, Pennsylvania. (Photo by Rob Tringali/MLB Photos via Getty Images)
1 of 5
Next
The Phillies will count heavily on Realmuto’s bat until some regulars return. Photo by Rich Schultz/Getty Images.
The Phillies will count heavily on Realmuto’s bat until some regulars return. Photo by Rich Schultz/Getty Images. /

Competing with the Phillies and two other clubs for the divisional pennant, the New York Mets could go in either direction –up or down– unless they can stay relatively healthy for the entire 162.

Wild card:

For the Philadelphia Phillies faithful, expectations range from a fourth-place finish to a World Series Championship depending on the faultfinding pessimist or the starry-eyed optimist. On the other hand, Mets supporters are leery of fast starts and the bite of the injury bug.

IN OTHER WORDS:  “Science is about predictions based on predictable fact. Life is about surprises based on the unpredictable reality.” — Ori Hofmekler

While the Fightins went 63-48 and 17-34 for an 80-82 season, the Metropolitans had a bookended campaign. They had a 12-2 start and an 18-10 finish for a 30-12 total but otherwise were 47-73 during their 77-85 summer. So, neither wants to repeat 2018.

As for changes, New York’s new GM added a young closer, an aging slugger, an offensive veteran behind the plate, two left-handed relievers, two infielders and an outfielder. The red pinstripes acquired a slugger, a top-ranked catcher, a .300-hitting shortstop, a leadoff man, a late-inning fireman and three relievers.

For the Mets, they have four outstanding starters and five solid regulars plus one slugger on the IL (injured list) who may return this year, but their pen other than their closer has question marks. Meanwhile, the Phils’ lineup is dangerous from one through eight, the bullpen is decent enough, and the rotation has potential.

A major factor for 2019’s divisional contenders is for their stars to avoid devastating injuries. Specifically, the Metropolitans have a recent history of being at a disadvantage due to prolonged absences. As for the hometown nine, they can lose a player to injury at any time.

Basically, New York is a wild card in this four-team race because of their injury history and a star who could return during the stretch drive. But can their prized starters stay healthy for most of ’19?

Regarding predictions, four national publications have the Mets finishing second to the Washington Nationals, while the Fightins have a third-place forecast. However, those foretellings are already changing, as the campaign progresses through April.
When the league catches up to Alonso, will he adjust? Photo by Rich Schultz/Getty Images.
When the league catches up to Alonso, will he adjust? Photo by Rich Schultz/Getty Images. /

Then and now:     

In ’18, the Phillies were 53-42 at the All-Star break, and fans enjoyed their first taste of winning since 2011’s franchise record of 102 triumphs. But the young squad deteriorated to a second-half mark of 27-40 due partially to the leadoff man playing with a broken foot and their veteran starter pitching through a knee injury.

After a 12-2 start, the Metropolitans fell to 26 games under .500 until their final 28 contests. But, coincidentally, their 18-10 finish allowed them to gain 10 games on the red pinstripes who went 8-20 during that time. So, New York tallied 77 wins to the Phils’ 80.

In head-to-head competition, the hometown nine were 5-5 at the Bank but 3-6 at Citi Field for an 8-11 total. However, Philadelphia won five of 11 contests against New York during their 17-34 finish. Five of 17?

Regarding the contract dumps of the Seattle Mariners, the Fightins added $32 million by moving their first baseman’s $35 million for the $67 million of Jean Segura and Juan Nicasio. And the Mets swapped two players’ $34 million for Robinson Cano‘s $120 million remaining through his age-40 season to secure closer Edwin Diaz.

Concerning their signings, New York picked up receiver Wilson Ramos, infielder Jed Lowrie and lefty reliever Justin Wilson. Ramos’ bat is a solid fit and provides protection for the cleanup hitter, plus another difference-maker is rookie first sacker Pete Alonso, who is off to a fast start: .325, eight homers and 21 RBIs through April 22.

As for the red pinstripes, four of their first five batters are now Andrew McCutchen (1), Segura (2), Bryce Harper (3) and J.T. Realmuto (5). And their previous one, three and four hitters are now at the bottom of the order. In the pen, the organization inked David Robertson for late-game threats.

The Mets took on $24 million per year for five seasons of Cano, 36, to acquire Diaz. Photo by Michael B. Thomas /Getty Images.
The Mets took on $24 million per year for five seasons of Cano, 36, to acquire Diaz. Photo by Michael B. Thomas /Getty Images. /

Strengths and weaknesses:     

The Phillies and Mets have two more battles in the Big Apple. On the plus side, Philadelphia scored 24 runs, allowed just one earned run in relief, but only had two good starts. Meanwhile, New York gave up no earned runs in relief during three of four contests, scored 17 runs, but only had two good starts as well.

For the Metropolitans overall, their five-man staff and lineup are their strong points, but the frames between the starter and Diaz are iffy. They need setup men to handle the seventh and eighth frames. Translation: adventures ahead! Offensively, will Alonso adjust to new approaches when hurlers have a book on him?

On the other hand, Mets fans have every reason to fear injuries because of their fragile rotation. And, notably, Ramos played only 191 games from 2011 through 2014 and 64 contests in 2017: half of his eight MLB summers. Meanwhile, their slugging left fielder will probably miss significant time as well.

Regarding the Phils, the offense is in scoring position with the bases empty, and the bullpen is frequently dependable. But when the one-two punch atop the rotation is between outings, three developing hurlers can provide either encouraging performances or disappointing efforts.

Healthwise, the hometown nine have mostly been fortunate in recent 162s because of their roster depth in the majors and on the Triple-A Lehigh Valley IronPigs. But, presently, they have Segura, Odubel Herrera, Scott Kingery, Robertson, Hunter and Arano on the IL; and the everyday eight can ill afford more injuries.

Concerning intangibles, the Fightins are winning and having fun, plus they are rarely out of most games. And they can strike at any moment, plus opposing moundsmen must decide –sometimes fatally– which hitter to face: Harper, Hoskins or Realmuto.

Harper’s fire can ignite the Phillies at any time. Photo by Matthew Stockman/Getty Images.
Harper’s fire can ignite the Phillies at any time. Photo by Matthew Stockman/Getty Images. /

Ever-changing forecasts:

Based on preseason educated guesses, four national publications foresee the Phillies with 86.5 victories: a high of 88 triumphs and a low at 85. Coincidentally, the order of the predictions reflects the starting staffs in this four-team race. For what it’s worth, the faithful probably disagree.

Original victory predictions from four national sources:

  • Nationals: 90, 86, 89 and 87 for an average of 88.
  • Mets: 87, 86, 88 and 85 for an average of 87.
  • Phillies: 87, 86, 88 and 85 for an average of 86.5.
  • Braves: 83, 82, 84 and 79 for an average of 82.

For New York, their forecast is for second place with 87 wins plus a high mark of 88 triumphs to a low of 85. And their foretelling is to finish one game behind the Nationals and a half game ahead of the Phils.

Current victory predictions from four national sources (through April 22):

  • Nationals: 89, 87, 89 and 87 for an average of 88.
  • Mets: 85, 89, 87 and 87 for an average of 87.
  • Phillies: 86, 88, 88 and 85 for an average of 86.8.
  • Braves: 85, 85, 86 and 79 for an average of 83.8.

While the boldfaced predictions above don’t change, the other three do. Now, the red pinstripes average is up to 86.8 wins, while the Mets remain at 87. In fact, no NL East franchise has a 90-triumph prediction in the current foretelling.

To sum up, two games were one-run victories that could have gone either way, and the other two contests were the difference between the Phils scoring 24 runs to the Mets’ 17. But don’t let that fool you because one word describes their next 15 games, and it is? Unpredictable!

McCutchen has solidified his hold on the leadoff spot. Photo by Rich Schultz/Getty Images.
McCutchen has solidified his hold on the leadoff spot. Photo by Rich Schultz/Getty Images. /

The Numerical Bible:

This review is not a sabermetrics article, which means no heavy statistical analysis. But because some readers rely on stats, this is only a reference: no reason to articulate the importance of these numbers.

More from Call to the Pen

New Phillies plate discipline for 2018:   

  • McCutchen: 21.3 K% and 13.9 BB% with a .368 OBP.
  • Segura: 10.9 K% and 5.1 BB% with a .341 OBP.
  • Harper: 24.3 K% and 18.7 BB% with a .393 OBP.
  • Realmuto: 19.6 K% and 7.2 BB% with a .340 OBP.

Former Phillies plate discipline for 2018:   

  • Santana: 13.7 K% and 16.2 BB% with a .352 OBP.
  • Alfaro: 28.9 K% and 2.6 BB% with a .324 OBP.
  • Crawford: 26.8 K% and 9.4 BB% with a .341 OBP.

New Mets plate discipline for 2018:   

  • Cano: 13.5 K% and 9.2 BB% with a .374 OBP.
  • Lowrie: 18.8% and 11.5 BB% with a .353 OBP.
  • Davis: 25.7% and 8.8 BB% with a .248 OBP.
  • Broxton: 31.5% and 12.4 BB% with a .281 OBP.

Former Mets plate discipline for 2018:   

  • Bruce: 20.8 K% and 11.4 BB% with a .310 OBP.
  • Flores: 9.8% and 6.8 BB% with a .319 OBP.

According to Fangraphs, low walk rates are only acceptable for players with exceptional power numbers. Here are plate-discipline comparisons.

RatingK%BB%
Excellent10.0%15.0%
Great12.5%12.5%
Above Average16.0%10.0%
Average20.0%8.0%
Below Average22.0%7.0%
Poor25.0%5.5%
Awful27.5%4.0%

New Phillies statistics for 2018:  

  • McCutchen, 32.5: 155 Gms., 682 PA, a .255 Avg., a .368 OBP, a .424 SLG, a .169 ISO, a .304 BABIP, 20 HR, 65 RBI, a .792 OPS and a 2.6 fWAR.
  • Segura, 29: 144 Gms., 632 PA, a .304 Avg., a .341 OBP, a .415 SLG, a .111 ISO, a .327 BABIP, 10 HR, 63 RBI, a .755 OPS and a 3.8 fWAR.
  • Harper, 26.5: 159 Gms., 695 PA, a .249 Avg., a .393 OBP, a .496 SLG, a .247 ISO, a .289 BABIP, 34 HR, 100 RBI, an .889 OPS and a 3.5 fWAR.
  • Realmuto, 28: 125 Gms., 531 PA, a .277 Avg., a .340 OBP, a .484 SLG, a .208 ISO, a .312 BABIP, 21 HR, 74 RBI, an .825 OPS and a 4.8 fWAR.

Former Phillies statistics for 2018:  

  • Santana, 33: 161 Gms., 679 PA, a .229 Avg., a .352 OBP, a .414 SLG, a .186 ISO, a .231 BABIP, 24 HR, 86 RBI, a .766 OPS and a 1.9 fWAR.
  • Alfaro, 25.5: 106 Gms., 377 PA, a .262 Avg., a .324 OBP, a .407 SLG, a .145 ISO, a .406 BABIP, 10 HR, 37 RBI, a .731 OPS and a 3.1 fWAR.
  • Crawford, 24: 49 Gms., 138 PA, a .214 Avg., a .319 OBP, a .393 SLG, a .179 ISO, a .286 BABIP, 3 HR, 12 RBI, a .712 OPS and a 0.3 fWAR.

New Mets statistics for 2018:     

  • Cano, 36.5: 80 Gms., 348 PA, a .303 Avg., a .374 OBP, a .471 SLG, a .168 ISO, a .329 BABIP, 10 HR, 50 RBI, an .845 OPS and a 2.3 fWAR.
  • Lowrie, 35: 157 Gms., 680 PA, a .267 Avg., a .353 OBP, a .448 SLG, a .171 ISO, a .314 BABIP, 14 HR, 69 RBI, an .801 OPS and a 3.6 fWAR.
  • Davis, 26: 42 Gms., 113 PA, a .175 Avg., a .248 OBP, a .223 SLG, a .049 ISO, a .233 BABIP, 1 HR, 5 RBI, a .248 OPS and a -0.6 fWAR.
  • Broxton, almost 29: 51 Gms., 89 PA, a .179 Avg., a .281 OBP, a .410 SLG, a .231 ISO, a .217 BABIP, 4 HR, 11 RBI, a .691 OPS and a 1.1 fWAR.

Former Mets statistics for 2018:  

  • Bruce, 32: 94 Gms., 361 PA, a .223 Avg., a .310 OBP, a .370 SLG, a .147 ISO, a .263 BABIP, 9 HR, 37 RBI, a .680 OPS and a 0.1 fWAR.
  • Flores, 27.5: 126 Gms., 429 PA, a .267 Avg., a .319 OBP, a .417 SLG, a .150 ISO, a .269 BABIP, 11 HR, 51 RBI, a .736 OPS and a 0.5 fWAR.

New Phillies statistics for 2018:       

  • Robertson, 34: 69 Gms., 69 2/3 Inn., a 3.23 ERA, 5 Saves, 21 Holds, a 2.97 FIP, a 3.09 xFIP, a 2.88 SIERA, a 1.5 fWAR and a 1.03 WHIP.
  • Alvarez, almost 30: 76 Gms., 63 Inn., a 2.71 ERA, 14 Holds, a 3.05 FIP, a 3.98 xFIP, a 3.78 SIERA, a 1.2 fWAR and a 1.16 WHIP.
  • Nicasio, 32.5: 46 Gms., 42 Inn., a 6.00 ERA, 19 Holds, a 2.99 FIP, a 3.18 xFIP, a 2.60 SIERA, a 0.8 fWAR and a 1.38 WHIP.
  • Pazos, almost 28: 60 Gms., 50 Inn., a 2.88 ERA, 19 Holds, a 3.60 FIP, a 4.15 xFIP, a 3.75 SIERA, a 0.5 fWAR and a 1.24 WHIP.

New Mets statistics for 2018:     

  • Diaz, 25: 73 Gms., 73 1/3 Inn., a 1.96 ERA, 57 Saves, 4 BS, a 1.61 FIP, a 1.78 xFIP, a 1.49 SIERA, a 3.5 fWAR and a 1.05 WHIP.
  • Wilson, 31.5: 71 Gms., 54 2/3 Inn., a 3.46 ERA, 16 Holds, a 3.64 FIP, a 4.05 xFIP, a 3.85 SIERA, a 0.6 fWAR and a 1.43 WHIP.
  • Avilan, 29.5: 70 Gms., 45 1/3 Inn., a 3.77 ERA, 2 Saves, 9 Holds, a 3.09 FIP, a 4.02 xFIP, a 3.57 SIERA, a 0.9 fWAR and a 1.37 WHIP.

Former Mets statistics for 2018:

  • Swarzak, 33.5: 29 Gms., 26 1/3 Inn., a 6.15 ERA, 4 Saves, 2 Holds, 1 BS, a 5.48 FIP, a 4.33 xFIP, a 3.90 SIERA, a -0.4 fWAR and a 1.59 WHIP.

Next. NL East crown: Phillies vs. Washington Nationals. dark

If you have any questions or opinions regarding Philadelphia Phillies players, please open the comments section.

Next