Los Angeles Dodgers: Could Cody Bellinger bat .400?

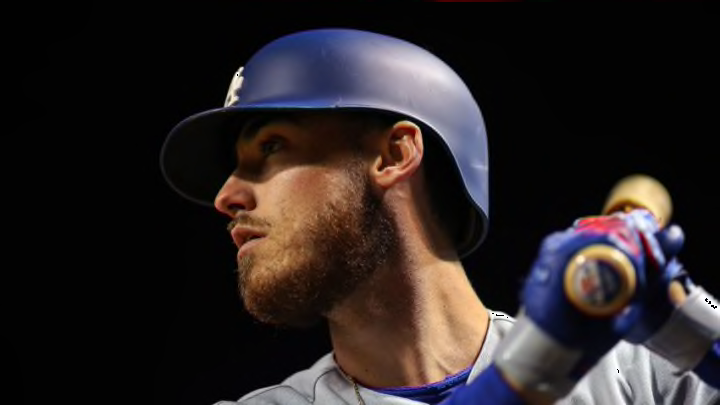
CHICAGO, IL - APRIL 24: Cody Bellinger #35 of the Los Angeles Dodgers looks on during the game against the Chicago Cubs at Wrigley Field on Wednesday, April 24, 2019 in Chicago, Illinois. (Photo by Alex Trautwig/MLB Photos via Getty Images)
2 of 7
Next
(Photo by Alex Trautwig/MLB Photos via Getty Images)
(Photo by Alex Trautwig/MLB Photos via Getty Images) /

It’s early, but the Los Angeles Dodgers star is profiling positively in many key indicators

For major league hitters, a .400 batting average is the unreachable goal.

It has been so for more than three-quarters of a century, nobody achieving it since Ted Williams batted .406 in 1941.

In fact, it’s been a quarter century since anybody even made a serious run at a .400 batting average. The last player who had a plausible chance to do so was Tony Gwynn, who won the 1994 batting title at .394.

That was Gwynn’s average when the mid-August player strike halted play, eventually resulting in the cancellation of the remainder of the season. Whether Gwynn might have attained that .400 mark had play been resumed will never be known.

As the 2019 season reaches the one-month mark, it’s just possible that visions of a .400 hitter might be revitalized. Los Angeles Dodgers outfielder-first baseman Cody Bellinger completed play Thursday batting .426.

Bellinger, who has played in all but one of his team’s games, his failed to hit safely only three times. But beyond the mere numbers, Bellinger is also showing other attributes required of a very high-average hitter.

Obviously, there’s far too much of the season yet to be played to actually forecast that Bellinger can maintain his lofty average. At the same time, one month provides enough to compare Bellinger with  those who have made such a serious run.

Let’s assess the skill set  that has propelled Bellinger thus far against five others – Williams, Gwynn, Rod Carew, George Brett and Ichiro Suzuki – who made a run at .400. Doing so may illuminate just how seriously to take the Dodger’s hot start as a harbinger of a banner season.

(Photo by Rich Pilling MLB Photos via Getty Images)
(Photo by Rich Pilling MLB Photos via Getty Images) /

27-game average

Looking strictly at batting average to this point in the season, Los Angeles Dodgers slugger Cody Bellinger’s candidacy is legit. But as the records of the immortals make clear, just as a hot start is no assurance of a .400 finish, neither is a relatively cool start necessarily a barrier.

There is no greater proof of that than Williams. On May 19, 1941, 27 games into what would become a .406 season, he was batting .342. Williams would not reach .400 for another week, and would not reach that level to stay until mid-July.

Brett started even more inconspicuously in 1980, batting just .269 through Kansas City’s 27th game. When Ichiro Suzuki finished the 2004 season with a.372 average, he was hitting just .285 through his team’s 27th game, played on May 5 that year. On his way to batting .388 in 1977, Carew was batting .340 through the Twins’ 27th game on May 7.

Gwynn is the only one who actually set an early .400 pace. Through San Diego’s 27th game of 1994, played on May 3, he was batting .402. He actually remained above .400 for 10 more days, and never fell far below that level.

So a .400 start isn’t an absolute requirement. But it is also not an assurance. Plenty of players have batted .400 or better for the season’s first month and then faltered. As recently as 2017, Washington Nationals’ first baseman Ryan Zimmerman carried a .435 batting average to May 7. Then Zimmerman went hitless in five of his next eight games and eventually finished at .303.
New York Yankees Joe DiMaggio and Boston Red Sox Ted Williams. (Photo by Bill Green/Sporting News via Getty Images)
New York Yankees Joe DiMaggio and Boston Red Sox Ted Williams. (Photo by Bill Green/Sporting News via Getty Images) /

Willing to walk?

One of the keys to making a run at .400 is a willingness to accept a base on balls rather than making outs on pitches outside the strike zone. Williams was legendary for his refusal to stray outside the strike zone.

During his 1941 season, Williams accepted a league-leading 147 bases on balls, reducing his 606 plate appearances to only 456 times when he was even susceptible to making an out. That put Williams’ walk rate at nearly one in four.

That skill is virtually non-existent in today’s game, and Bellinger has only begun to refine it. To date he has accepted 14 walks in 108 plate appearances, a 13 percent walk rate.

But it may encourage Bellinger backers to know how much of an exception Williams was even among the greats. When he made his 1980 run that ended at .390, Brett’s walk rate was only 11 percent. During their 1977 and 1994 attempts, the walk rates for both Carew and Gwynn were just 10 percent. And Suzuki accomplished his career-best .372 batting average in 2004 despite only a 6.5 percent walk rate.

The lesson here is this: While running up a high walk total tends to reduce the prospect of making outs, it isn’t an absolute requirement to a high average. And to the extent that it is, Bellinger seems to be holding his own with most of the past half century’s serious .400 challengers.

Rod Carew of the Minnesota Twins, batting star, is shown at bat at Yankee Stadium.
Rod Carew of the Minnesota Twins, batting star, is shown at bat at Yankee Stadium. /

K-avoidance

Any ball that is put in play has a chance to become a hit. That makes strikeout-avoidance an essential component of a run at a .400 batting average.

In this area as in so many others, Williams was a master. In 1941, he whiffed only 27 times, or just 4.4 times per 100 plate appearances. And when Williams swung, he gave good things a chance to happen.

This is perhaps the most common attribute of very high average hitters. When Brett batted .390 in 1980, only 4.2 percent of his trips to the plate ended in a strikeout.  For Gwynn in 1994, the figure was 4.0 percent; for Carew in 1977, it was 7.9 percent. Of all the high-average hitters since Williams, Suzuki had the highest strikeout rate, and it was only 8.3 percent in 2004.

In today’s power-focused game, these kinds of figures are unthinkable. And that tendency to fail to put the ball in play is probably the largest obstacle to Bellinger or anybody else actually approaching .400.

Having said that, it’s worth noting that Bellinger’s strikeout rate thus far in 2019 is only 11.7 percent, roughly half the MLB average. It’s also looming as Bellinger’s single greatest area of improvement. In 2018, when he finished with a .260 batting average, Bellinger struck out 151 times. His career strikeout rate entering 2019 was 25 percent.

August  12, 1980: Close-up of George Brett, Kansas City Royals’ third baseman.
August  12, 1980: Close-up of George Brett, Kansas City Royals’ third baseman. /

Zone Contact

When pitchers dare to pitch inside the strike zone, the best batters make them pay. That’s what Bellinger is doing.

The best measurement of this ability is a statistic called Zone Contact. It’s pretty straightforward: When you swing at a strike, how frequently do you actually make bat-on-ball contact. The higher your Zone Contact rate, the better.

In MLB, the average Zone Contact rate is about 87 percent. That tells you something that ought to be instinctive: when batters get a good pitch to hit, they usually hit it. Not necessarily for a knock, but they put it in play.

At 87 percent to date, Bellinger’s 2019 Zone Contact rate is unremarkable, but solidly within the average spectrum. One aspect holding it back may be his selectivity. Bellinger has swung at only about two-thirds of pitches thrown in his strike zone.

In hitting, there is a delicate balance between aggressiveness in the strike zone and foolhardiness outside the zone. The previously cited change in Bellinger’s strikeout rate between 2018 and 2019 suggests he may be in the process of becoming more selective. But it’s also possible he’s doing so at the price of letting some highly hittable pitches slide by him.

Since Zone Contact rate is one of those new Statcast numbers, we cannot compare Bellinger’s rate with any of the players from previous eras.

Ichiro Suzuki of the Seattle Mariners puts on a pad before batting against the Oakland Athletics at Network Associates Coliseum on April 11, 2004 (Photo by Justin Sullivan/Getty Images)
Ichiro Suzuki of the Seattle Mariners puts on a pad before batting against the Oakland Athletics at Network Associates Coliseum on April 11, 2004 (Photo by Justin Sullivan/Getty Images) /

Chase rate

Nor can we compare him to his predecessors in Chase Rate, the second generally recognized component of very high-average hitters. Remember Williams’ first rule of hitting: Get a good pitch to hit.

Like Zone Contact rate, Chase rate is essentially what it sounds like: the percentage of times a batter swings at a pitch that is not in the strike zone.  While there are from time to time exceptions, Vlad Guerrero seemed to be able to line any pitch for a single – as a rule of thumb, you want your Chase rate to be as low as possible.

Here, Bellinger is again showing progress. His 2019 Chase rate is 20.9 percent. That’s about 10 percentage points below the MLB average of about 30 percent and it’s several points below Bellinger’s 2017 and 2018 numbers which were between 23 and 24 percent.

With rare exceptions for people such as Guerrero, a low Chase rate enhances a batter’s chance for a high average in several ways, most of them obvious when you give the matter a bit of thought.

Batters tend to make more outs on pitches outside the strike zone. A lower Chase rate reduces those self-inflicted outs.

It also increases the prospect of a base on balls, which also drives up batting average. Suzuki’s 2004 season is a case study in this respect. Ichiro got 262 hits that season…but because he took only 49 walks he needed 704 official at bats to get those hits. Had he merely accepted walks at the MLB average rate of 8.6 percent, he would have earned an additional 17 walks…and the odds are that those 17 would have come on outs he did NOT make.

Ted Williams of the Boston Red Sox.
Ted Williams of the Boston Red Sox. /

Demographics

Finally, there is the matter of raw demographics, which as a general rule look favorably on Bellinger’s chances to make a serious run at a very high batting average this season.

More from Call to the Pen

Like Williams, Brett, Carew, Gwynn and Suzuki, Bellinger is left-handed, conferring on him the chance to hit against a preponderance of opposite-side pitching and at least a minimal advantage in getting to first base.

In 1941, Ted Williams was 22 and in his third major league season when he hit .406.

Brett was in his seventh full season when he hit .390 in 1980, but he was only 27 years old.

Suzuki was in just his fourth major league season in 2004, but he was 30, having established his reputation in the Japanese League.

Carew and Gwynn are exceptions. Carew was 31 and in his 11th season, Gwynn 34 and in his 13th major league season when they hit .388 and .394 respectively.

Misconceptions about the Black Sox scandal. dark. Next

And even if Los Angeles Dodgers Cody Bellinger doesn’t reach .400, one other demographic suggests he is the most likely candidate to win the batting title. Williams, Brett, Carew, Suzuki, and Gwynn all won batting titles in their third full seasons. Williams, Brett, Carew, and Gwynn were all 23 or 24 that year. Bellinger is 23 and in his third season.

Next