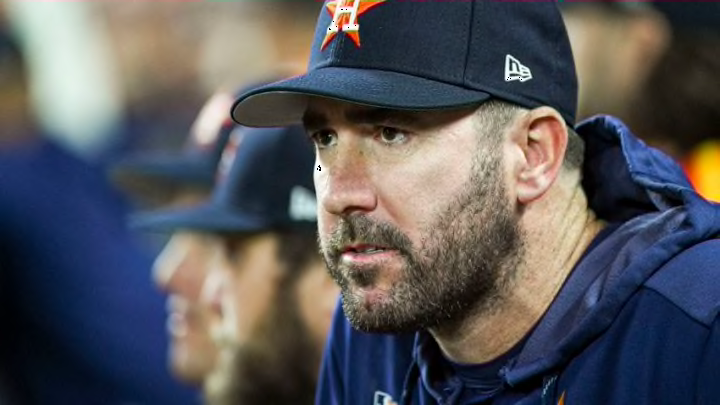
The Disparity Between FIP and ERA Explained
In calculating FIP you only take into consideration hitter outcomes that are out of the control of fielders. Home runs, walks, hit by pitches, and strikeouts are all outcomes that don’t involve fielders.
More from Call to the Pen
- Philadelphia Phillies, ready for a stretch run, bomb St. Louis Cardinals
- Philadelphia Phillies: The 4 players on the franchise’s Mount Rushmore
- Boston Red Sox fans should be upset over Mookie Betts’ comment
- Analyzing the Boston Red Sox trade for Dave Henderson and Spike Owen
- 2023 MLB postseason likely to have a strange look without Yankees, Red Sox, Cardinals
In Justin Verlander’s case, he checks off strikeouts, walks, and hit by pitches because he ranks FOURTH in MLB with an 11.98 SO/9, Leads the AL with a 1.63 BB/9, and has only plunked SIX hitters in close to 200 IP. However, when it comes to home runs, Verlander has the SEVENTH highest HR/9 (1.54) in MLB.
In fact, this season, Verlander has the 10th worst HardHit% (42.3%) in MLB. Pair that with his 47.3 FB% and it’s no surprise that he has the THIRD highest home run total of any pitcher in MLB. This has resulted in him giving up 33 home runs in 2019 alone, the most he ever has before.
What’s more, of the 57 runs scored on Verlander this year, at least 33 (or 58%) of them have come via home runs. Take into consideration that some of these home runs may have occurred with runners on base and that number is much higher.
Conversely, his ERA is so much lower than his FIP because he happens to play on one of the best fielding teams in MLB.
To check this, I looked at how many runs the Houston Astros saved this season and it turns out they have a stellar 80 DRS this season, that’s tops in the AL and fourth-best in MLB. In terms of RngR (Range Runs), the Houston Astros trail only the Minnesota Twins in the AL and rank FOURTH best in all of baseball.
Finally, give Verlander credit where credit is due. At the age of 36, he continues to mow hitters down and understands how to play to his team’s strengths. Trust the guys behind you to make the plays and understand that solo home runs here and there won’t kill you at the end of the day.
