MLB: How baseball has changed over the decade

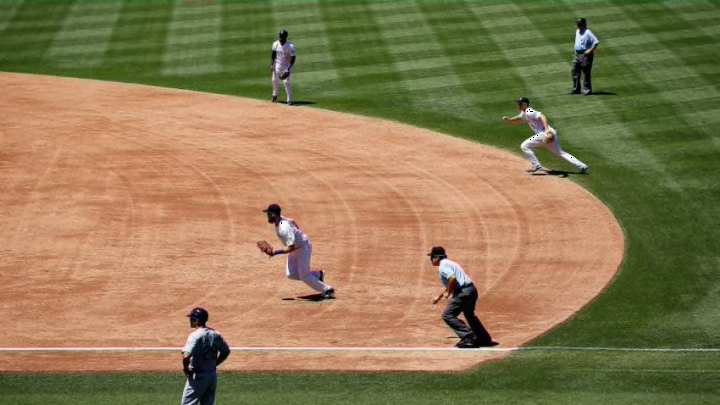
DENVER, CO - AUGUST 05: The Colorado Rockies infield employ the infield shift as they defend against the Seattle Mariners during interleague play at Coors Field on August 5, 2015 in Denver, Colorado. The Rockies defeated the Mariners 7-5 in 11 innings. (Photo by Doug Pensinger/Getty Images)
8 of 8
Next
(Photo by Norm Hall/Getty Images)
(Photo by Norm Hall/Getty Images) /

This MLB season concludes a decade of profound changes throughout the game

The MLB game of 2029 will be substantially different from the game we watch today.
How? That can’t be predicted. But given baseball’s constantly evolving nature, change is inevitable.
A review of the numerous profound ways the game has changed merely since 2009 illustrates the inevitability of these changes, which have occurred on the mound, in the field, in the batter’s box, in the dugout, in the front office…and in some cases even in the ballpark’s environs.

We can measure those changes both in numbers we are familiar with and also in numbers that didn’t exist in 2009. Just to pick a couple: in 2009, the average hitter batted .262; today he hits .252, nearly a 4 percent performance decline in that metric. On base average is also down, from .333 in 2009 to .323 in 2019.

Perhaps confusingly, ERAs have risen even as batting averages have fallen off. In 2009 the average ERA was 4.31; during the just-completed season, it was 4.49, about 4.2 percent higher. The reasons for that seeming dichotomy between declining batting averages and rising ERAs have everything to do with more profound changes in the game’s play, and will be discussed momentarily.

MLB ballplayers are, as a group, younger. Perhaps a byproduct of the generally higher salaries earned by more veteran players, the average age of a 2019 player was 28.1 years, about six months younger than the 28.6 year average age a decade ago.

Those, however, are merely the superficial, and generally the smallest, changes. Far, far more important have been the ways in which teams research, plan and execute a season, and also the methods they employ to make player personnel decisions.

(Photo by Rich von Biberstein/Icon Sportswire via Getty Images)
(Photo by Rich von Biberstein/Icon Sportswire via Getty Images) /

Shifting strategies

In 2009, Joe Madden, then manager of the Tampa Bay Rays, was the only guy even experimenting with shifts. The idea of unbalancing the standard defensive alignment was so far off the accepted grid that not until 2016 did Baseball Savant even begin tabulating MLB shift frequencies.

That season, teams shifted on an average of 13.7 percent of plays. By then, the Houston Astros were the game’s shiftiest team, using the maneuver on more than one-third of their defensive opportunities.

Ironically, Madden – by then nursing Chicago’s North Siders to their first World Series title in more than a century – largely disdained the maneuver he had brought into the baseball world. The champion Cubs employed a non-standard alignment only 4.6 percent of the time, fewer than all but one MLB team.

Fast-forward just three seasons. By 2019, the rate of shifting had nearly doubled, to a full one-quarter of plays across all of baseball. The Astros shifted 49.4 percent of the time, yet they did not lead the majors because the Dodgers exceeded a 50 percent shift rate.
Eight teams shifted on more than one-third of their plays, which is to say more than any team had done just three seasons earlier.

Joe Maddon? By 2019 the shift’s popularity had increased his frequency to 12.7 percent, three times the Cubs’ rate from 2016. The world was unimpressed; in 2019 Maddon’s Cubs were baseball’s least likely team to employ a shift.

(Photo by Dustin Bradford/Getty Images)
(Photo by Dustin Bradford/Getty Images) /

Pitcher usage

In 2009, the last year of the previous decade, 117 MLB pitchers started at least 20 games. They were, in other words, rotation regulars. Over the century’s second decade, the number of pitchers employed primarily as starters hardly moved at all; 113 made 20 or more starts in 2019.

But if the ranks of starters remained roughly the same, reliance on those starters decreased sharply. In 2009, those 117 pitchers covered an average workload of 176.8 innings per pitcher, or about one-half the 1,400 innings required of a team over the course of a 162-game season.
By 2019, that same cadre of starters covered an average of just 161.8 innings, nearly a 10 percent reduction in starter workload over the course of the decade.

In 2009, Detroit’s Justin Verlander was the game’s premier workhorse, covering 240 innings. The 10 most heavily used starters averaged about 232 innings.

In 2019, Verlander – now with Houston – remained the game’s hardest-working pitcher…but with 223 innings, about seven percent fewer. The 10 hardest workers averaged just 211 innings, a nine percent decline in workload.

The disbursed workload worked its way all through the staff. By 2019, teams were averaging 18.2 pitchers with at least 20 innings of work, two more bodies more than a decade earlier. Yet fewer pitchers worked 75 and 125 innings in 2019. This season 62 pitchers delivered the minimum 162 innings required to qualify for consideration for the ERA title; a decade earlier, 79 pitchers reached that threshold.

(Photo by Dilip Vishwanat/Getty Images)
(Photo by Dilip Vishwanat/Getty Images) /

The long ball

Obviously, MLB teams emphasize the long ball more today than ever in history…but how much greater that emphasis is may still be surprising.

In 2019, MLB teams averaged 226 home runs, a full 34 percent increase from the 168 those same teams averaged during the final season of the century’s first decade.

That 34 percent increase has hardly been a gradual or incremental one. As recently as 2014, the average number of home runs per team had actually fallen, to 140.

Since 2014, however, changes in the approaches teams take to generating offense – most of them empowered by the increasing role the study of physics has played in coaching – have delivered a boost to power that is almost logarithmic.

The table below, which shows the change in home runs per team per season, illustrates this. acceleration.
Season      HR/team      Change
2009              168
2010              154              -9.4%
2011              152              -1.3%
2012              164                7.9%
2013              155              -5.5%
2014              140              -9.7%
2015              164              17.1%
2016              187              14.0%
2017              204                9.1%
2018              186              -8.9%
2019              226              21.5%

The impact of this change shows up dramatically in individual home run performance. In 2009, 87 major league players – just short of three per team – reached the 20 home run threshold. By the 1014 season, that number had actually dropped to just 57 – fewer than two per team.

Yet during the 2019 season, 130 players – more than four per team and more than twice as many as five years earlier – reached the 20 home run plateau.

The home run increase has driven a concurrent increase in run production that defies a decline in batting average. In 2009, the MLB batting average was .262, and teams produced 4.61 runs per game. In 2019, averages fell to .252, but runs per game rose nearly five percent to 4.83. Hitters had become efficiency experts.

(Photo by Michael Reaves/Getty Images)
(Photo by Michael Reaves/Getty Images) /

The whiff

It’s been more than 15 years since a researcher named Voros McCracken unveiled the concept of the Three True Outcomes, those events that were totally and utterly beyond the realm of luck. The three – home runs, strikeouts and bases on balls — had always been recognized independently for their importance, but they soon entered the analysts’ lexicons as a collective.

Over the past decade, teams have focused on the run-scoring importance of the Three True Outcomes to such an extent that in 2019 teams averaged 2,183 “true outcomes” per season, an 18.58 percent increase from one decade earlier.

The increase in home runs has already been documented. But the increased acceptance of strikeouts is even more dramatic. In 2009, teams struck out an average of 1,120 times per season. By the end of this season, that average had catapulted to 1,427 strikeouts per team, a 27.5 percent increase.

One decade ago, teams were only beginning to develop a tolerance for the K. In 2008, Mark Reynolds became the first player in history to strike out 200 times in a single season, and one year later he raised his record to 223. At that time, even the 190 strikeout barrier had been breached just seven times, all of those occurring since 2004.

Today, Reynolds’ 223 remains the major league record, but it is decidedly under siege. In the past decade, 23 players have fanned at least 190 times, and 11 have done so at least 200 times.
Nine times in the past decade, the major league record for strikeouts per team has been broken. The only exception was 2015, when teams averaged 1,248 strikeouts, exactly matching their 2014 average performance.

The change over the decade amounts to 283 strikeouts per team. To find a similar amount of change over time, you have to reach back from 2009 all the way to 1983, more than a quarter century into the game’s past.

(Photo by Michael Zagaris/Oakland Athletics/Getty Images)
(Photo by Michael Zagaris/Oakland Athletics/Getty Images) /

More bosses

Part of what’s driving all this change in the way the game is played is a substantially expanded MLB front office structure. That change has taken two forms.

Until Billy Beane nurtured the concept, no major league front office devoted much time or energy to the statistical analysis of talent. Beane stole most of his ideas from Bill James, whose seminal 1980s work created the concept of SABRmetrics, as a defensive measure. Beane’s Oakland Athletics lacked the money to compete with his richer competitors on normal terms.

Within a few years, Beane clones – Dan Evans and Paul dePodesta in Los Angeles, J.P. Ricciardi in Toronto and Mark Shapiro in Cleveland – spread his gospel. The Boston Red Sox went the rest of baseball one better hiring Bill James himself as a consultant.

They didn’t all succeed, but within a few years virtually every big league team had come to the same conclusion: they needed to understand – and to at least some extent build their team around – stat analysis.

That realization led to the decade’s second major development: the creation of full departments tasked with developing game and lineup-related strategies that made statistical sense. Today, every team has such a department, and their influence is so profound that in some instances they have been accused of supplanting field managers as decision-makers.

Indeed, as the decade ends one of recurring points of debate is whether decisions once the sole province of the manager – who bats second, when a pitcher is replaced – are now being made by some suited Ivy League graduate nerd who never stood in a batter’s box at any level higher than Little League…and whether that’s a bad thing.

(Photo by Victor Decolongon/Getty Images)
(Photo by Victor Decolongon/Getty Images) /

Adding up the stats

One decade ago, nobody analyzed a pitcher’s performance on the basis of ERA+ because that stat didn’t exist. Linear weights – which measures the contribution of every offensive outcome to run production – did exist; it was developed by Pete Palmer in the mid 1980s. Its use, however, was confined to eggheads.

But with the popularity of such sites as Fangraphs (launched in 2005) and such stat-focused TV shows as MLB Now (2013), interest in the statistical analysis of baseball has spread rapidly.
As recently as 2006, Minnesota’s Justin Morneau was able to win the American League’s Most Valuable Player Award despite finishing outside the top 10 in all of the following statistical categories; batting average, home runs, WAR and OPS+.

He triumphed for the kinds of perceptual reasons that used to govern MVP awards: He was an offensive leader on a team that won its division while improving by 13 games over the previous season.

Today, the value of each player is extensively – and largely accurately – reduced to a single number by any of several metrics that either did not exist or were little known a decade ago. Those metrics include Win Probability Added, Weighted Win Expectancy, Barrel Rate, Chase Rate, Exit Velocity and Launch Angle…plus a couple dozen more. WAR and OPS+ are merely the most widely understood of that increasingly vast collection.

(Photo by Joe Robbins/Getty Images)
(Photo by Joe Robbins/Getty Images) /

The very much bigger bucks

In 2009, the average Major League baseball team had $193.9 million in annual revenues. Almost all of that came from two sources, attendance and media, almost all of the latter being TV/radio.
In 2019, MLB teams averaged a daily gate of a few hundred above 28,000. That’s about 2,000 fewer fans (6.7 percent) than the average attendance from 2009. So how much have team revenues declined as a result?

More from Call to the Pen

The obvious answer is: They haven’t … not even close. In fact, MLB teams have shrugged off the decreased gate interest because they have in the interim opened up substantial new revenue streams.

Several teams today are renting out their ballparks for far more non-baseball events – concerts and the like – than ever before. Beyond that, many have found ways to monetize their environs by buying up those environs and converting them into game-related sites: apartments, restaurants, offices and public parks. Online revenue sources, streaming and team-specific revenue sources also exist.

In a handful of cases – the rooftop bleachers outside Wrigley Field being the obvious example – teams have worked out leasing or purchase agreements to get a piece of that action as well….and in some cases all of that action.

Through those means and others, teams have not only weathered the decade but flourished through it. In 2009, the average revenue of the 30 MLB teams was just under $194 million. Today, that revenue figure has almost exactly doubled, to an average of $387.5 million.

Those increases are not, of course, uniform. The Dodgers are basking in a $308 million revenue increase since 2009, about $250 million more than the Oakland Athletics.

Nevertheless, revenues for two-thirds of teams have grown in excess of $100 million across the decade. Not a single team is scraping by today on less than 36 percent more revenue than it took in a decade ago.

Granted, inflation eats up a part of that…although in most cases it’s a small part. The inflation rate since 2009 is 20 percent. According to statistics provided by Forbes and by Statista.com, that’s a little more than half the income growth of the game’s poorest team, the Athletics.

dark. Next. 2020-21 free agent class affecting this year

The players have shared in this increased wealth, although not necessarily proportionately.
In 2009, the average MLB Opening Day payroll was about $89.2 million. In 2019, the comparable figure was $133.8 million, a 50 percent increase.
Next