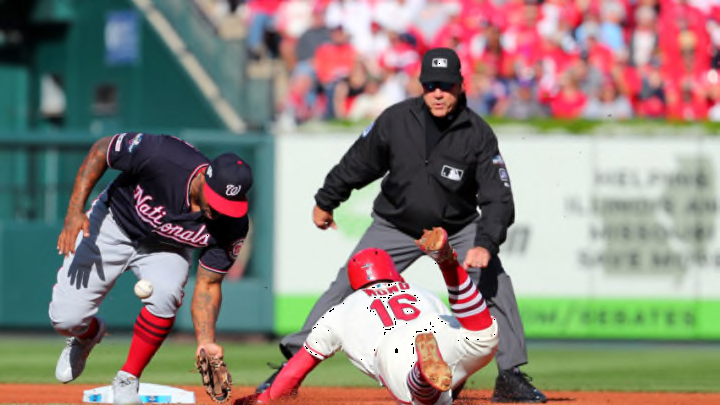
A calculation of the on-field dollar value of the 10 most valuable MLB first basemen of the 2019 season. Offensive and defensive measures are included.
In MLB, we’re pretty much obsessed with the concept of value. We apply a plethora of often exotic statistical approaches to measure it: batting average, slugging, home runs, WAR, OPS+, Defensive Runs Saved, Weighted Runs Created…the list goes on.
The one factor we generally overlook in all these assessments is the most meaningfully value-oriented of all of them: salary. What, precisely, was the player paid – relative to all other players tasked with doing what he was doing – and how much of that pay did he “earn?”
The rating system that follows corrects that oversight. Based on 2019 performance, it measures which players were the most “valuable” as judged by their on-field production relative to the average salary of their positional peers. And let it be noted here that we are limiting our focus to on-field value only. Some players, megastars, are paid based largely on factors unrelated to on-field performance, their drawing power at the gate, their celebrity, their endorsement/promotional potential being among them. Those factors, while acknowledged as real, are not part of this discussion.
Since different positions require different skills, the standard for determining production will vary depending on position…although for position players there will always be an offensive component.
Today we’re looking at second base, a defensive-oriented position. Our criteria contain four components that weight toward the defensive. Because offensive production is a significant responsibility at any position, 45 percent of the rating is based on offensive WAR. But at second base, 20 percent is tied to fielding percentage, and another 20 percent is based on range per nine innings. The final 15 percent is based on innings played; showing up remains a meaningful trait.
We’re going to discover that the talent spread at second base is substantially greater than at first base, where the dollar difference between the 10th best and best players only amounted to about $3.5 million.
As a group, the 35 second basemen who qualified for consideration – based on a minimum of 400 innings at the position – earned about $100 million less than their first base counterparts. But because first base talent was far more homogenized, the value spread among the best second basemen is greater, amounting to a $4.5 million spread between No. 10 and No. 1.
For purposes of establishing a norm, here are the positional averages:
Salary: $4.855 million
WAR: 2.051
Fielding percentage: .980
Range for 9 innings: 4.103
Innings: 962.314
