The all-time Kansas City Royals bracket

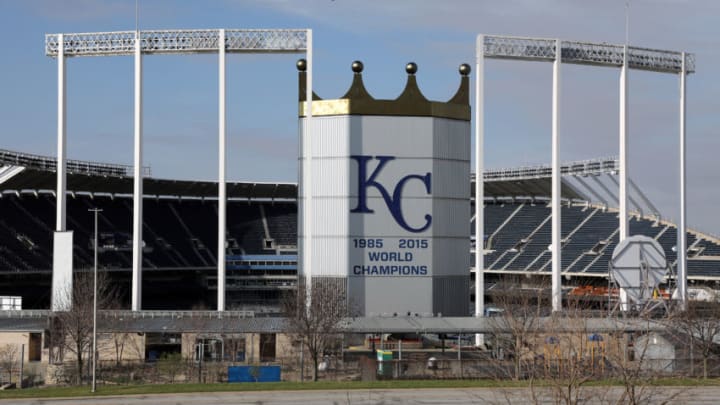
KANSAS CITY - MARCH 26: An empty Kauffman Stadium, home of the Kansas City Royals, is shown on what would have been Major League Baseball's Opening Day on March 26, 2020 in Kansas City, Missouri. The start of the season has been postponed due to the COVID-19 outbreak. League Commissioner Rob Manfred recently said the league is "probably not gonna be able to" play a full 162 game regular season. (Photo by Jamie Squire/2020 Getty Images)
6 of 7
Next
(Photo by Jamie Squire/Getty Images)
(Photo by Jamie Squire/Getty Images) /

It’s George Bret vs. the 2014-15 teams for the honor of best in Kansas City Royals history

The Kansas City Royals franchise is a half century old having been founded in 1969. But the franchise’s history is dominated by one name: George Brett.

A Hall of Famer who spent his entire career with the Royals, Brett is a major player on seven of the franchise’s nine post-season teams, all but the 2014 and 2015 World Series clubs. Of the eight teams selected to fill out the Royals all-time bracket, Brett was a star on six.

The bracket begins with the franchise’s two World Series champions, the 1985 and 2015 teams. It also includes the 1980 and 2014 teams, which reached the World Series before losing.

The remaining four Royals representatives are logically selected from among the last five post-season teams, those of 1976, 1977 1978, 1981 and 1984. The selection process is deceptively easy. The strike-shortened and cleaved 1981 season produced several anomalies, not least was the presence of the Royals in post-season play

That team won only 50 of the 103 games it played, but finished ahead of Oakland in the second half to meet the A’s, who swept them in the division series. The 1981 Royals, then, are stricken from consideration and the 1976, 1977, 1978 and 1984 teams fill out the bracket.

The format is identical to previous bracket challenges. Each matchup in the tournament is decided based on seven criteria. You can think of each as a ‘game,’ the winner of four games advancing. The seven criteria are:

Game 1: Regular season winning percentage.

Game 2: Post-season winning percentage

Game 3: Team OPS+

Game 4: Team ERA+

Game 5 (if necessary): Team WAR

Game 6 (if necessary: Fielding percentage above the league average for the season in question.

Game 7 (if necessary): Hall of Famers or likely future Hall of Famers

No. 1 vs. 8 seed

(Photo by Jamie Squire/Getty Images)
(Photo by Jamie Squire/Getty Images) /

The most recent Royals World Series winners, the 2015 team, are the top seed. Those Royals won the AL Central by 12 games, and their 95-67 record was the American League’s best.

Center fielder Lorenzo Cain batted a team-leading .307, while DH Kendrys Morales drove in 106 runs.

On the mound, the Royals benefitted from a mid-season traded that added Johnny Cueto from Cincinnati. But the aces were Edinson Volquez and Yordano Ventura., who combined for 26 wins in 61 starts.

The bullpen was Kansas City’s best asset. The threesome of Kelvin Herrera, Wade Davis and Greg Holland covered 181 innings, and recorded 49 saves.

The 1984 Royals won a non-descript AL West with an 84-78 record that would have brought them home sixth in the far tougher East. In the post-season Detroit out-classed Kansas City in three games.

Brett hit .284 but DH Hal McRae covered him at .303 and center fielder Willis Wilson batted .301 with 47 steals. Bid Black led the pitching staff with a 17-12 record and 3.12 ERA in 35 starts.

Game 1: The 2015 Royals won 95 games, and their .586 regular season percentage lapped the 1984 club by 11 games.

Game 2: Another win for 2015, whose .687 post-season percentage outclasses the 1984 team’s zero-for-three against Detroit.

Game 3: Both teams compiled 98 OPS+. That sends this game to a tie-breaker, which involves the top individual OPS+ among the regulars. That belongs to Morales of the 2015 club at 127. The best among the 1984 Royals was first baseman Steve Balboni at 123.

Game 4: With a 112 staff ERA+, the 2015 team again out-classes 1984, whose staff ERA+ was 102.

Result: 2015 in four games

(Photo by Focus on Sport/Getty Images)
(Photo by Focus on Sport/Getty Images) /

No. 4 vs. 5 seed

In 2014, the Royals won the American League pennant, but lost a pulsating World Series in seven games to San Francisco. Save for the mound presence of James Shields, the cast was largely identical to the 2015 team. Cain batted .301 and Shields went 14-8 in 34 starts. Holland, Davis, and Herrera combined for 49 saves in 204 innings.

The 1977 Royals were the second of three consecutive Kansas City teams to lose a heartbreaking post-season series to the New York Yankees.  This team won 102 games – still a franchise record –and captured the AL West by eight games ahead of Texas.

They took a 3-2 lead into the ninth inning of the decisive fifth ALCS game at home only to watch the Yankees score three times off Dennis Leonard, Larry Gura and Mark Littell. Ironically, the last of those three runs crossed the plate on an error by Brett.

Game 1: The 1977 team’s 102-60, .630 regular season record is the best in franchise history.

Game 2: The 2014 team swept through the pre-World Series rounds undefeated before losing to Madison Bumgarner and the Giants in seven games Their post-season record was 11-4, .753. The 1977 team went 2-3, .400

Game 3: The 1977 Royals had by far the superior offense, with a 109 OPS+. The 2014 club managed just 92, a sub-par performance.

Game 4: In 1977, Leonard, Gura, Paul Splittorff and the rest posted a 115 staff ERA+. That’s better than the 2014 team’s 113 ERA+.

Game 5: The 1977 team had a cumulative 51.0 WAR. In 2014, the Royals WAR was 41.9.

Result: 1977 in five games

/

No. 2 vs. 7 seed

The 1985 Royals benefitted from umpire Don Denkinger’s bad call on a late play at first base on the way to beating St. Louis in seven games. But it was a solid team led by Brett’s .335 season with 30 home runs and 112 RBIs.

Bret Saberhagen went 20-6 in 32 starts, but four other Royals posted double-digit win totals. Closer Dan Quisenberry recorded 37 saves in 129 innings.

The 1976 Royals were the first great team featuring Brett. At .333, he won his first of two batting titles, delivering a career-high 215 base hits.

As they would in 1977 and 1978, the Royals ran afoul of the Yankees in post-season. This time the villain was Chris Chambliss, whose ninth inning home run off Littell broke a 6-6 tie in the decisive fifth game.

In the regular season, McRae batted .332, losing the title to Brett by one point. Leonard went 17-10.

Game 1: By one game, the 1985 club’s 91-71 .562 beats out the 1976 team’s 90-72 .556 percentage.

Game 2: The 1985 team had a .571 post-season record, the 1976 club managed only .400.

Game 3: in OPS+, the Brett-McRae led 1976 team compiled a 103 that was eight points better than 1985’s 95 OPS+.

Game 4: The 1985 Royals had a deep staff, and it shows up in their 118 team ERA+. That’s a franchise best. The 1976 team stopped at 110. This series is even at two games each.

Game 5: The 1985 Royals managed only an ordinary 39.6 WAR. The 1976 team’s 43.0 WAR is not great by championship standards, but it’s good enough.

Game 6: In 1985, the Royals fielded .980, one point better than the league average. The 1976 team fielded .978, also one point better. Carried out to extra digits, the precise figures give the edge to 1985, 1.045 to 0.948.

Result: 1985 in six games

(Photo by Focus on Sport/Getty Images)
(Photo by Focus on Sport/Getty Images) /

No. 3 vs. 6 seed

The 1980 Royals were the first team in franchise history to play a World Series game. After defeating the Yankees in the ALCS, they lost to the Philadelphia Phillies in six games.

Brett had his best season in 1980, flirting with a .400 batting average before winning the league title at .390. He drove in 118 runs. Wilson produced a .326 average and 79 steals for that team.

On the mound, Gura went 18-10 in 36 starts, he and Leonard combined for 38 wins in 74 starts, and Quisenberry saved 36 games.

In 1978, Brett had a down year for him, batting .294. Center fielder Amos Otis led the team at .298 with 22 home runs and 96 RBIs.

Leonard produced a 21-17 record in 40 starts totaling 295 innings. This time, the post-season heartbreak came in just four games, as usual to New York.

Game 1: The 1980 team’s 97-65 record amounts to a .599 percentage, five games better than 1978’s 72-70, .568.

Game 2: In post-season play, the 1980 team went .555. The 1978 Royals won only one of their four post-season games.

Game 3: The 1978 Royals had a103 OPS+. The 198o team went that five points better at 108.

Game 4: The 1978 Royals avoid a sweep with a 111 staff ERA+. The 1980 team’s ERA+ was 105.

Game 5: At 44.9, the 1980 team’s WAR was less than world class. But it was good enough to beat the 1978 team’s 42.9 WAR.

Result: 1980 in five games

(Photo by Jamie Squire/Getty Images)
(Photo by Jamie Squire/Getty Images) /

2015 vs. 1977

The 2015 World Series winners face the best team of the Royals’ 1970 era.

Game 1: The 1977 Royals had a .630 winning percentage based on a 102-60 record that is the best in franchise history. The 2015 team was 95-67 .586.

Game 2: The 2015 team’s World Series win came with a.687 post-season record. The 1977 team’s post-season percentage was .400.

Game 3: At 98, the 2015 team’s OPS+ is ordinary. The 1977 team’s 109 OPS+ is clearly a winner.

Game 4: The 1977 Royals produced a 115 staff ERA+, three points better than 2015’s 112.

Game 5: At 51, the 1977 team’s WAR was nearly 10 points better than the 2015 team’s 44.1.

Result: 1977 in five games

1985 vs. 1980

Two memorable World Series competitors square off in the second semi-final.

Game 1: The 1980 team had a 97-65 regular season record for a .599 percentage. In 1985, the Royals were 91-71, .562. That’s a win for  1980.

Game 2: The 1985 team won the World Series with a .571 post-season record. The 1980 team lost the World Series, and its .555 post-season percentage comes up just short.

Game 3: The 1980 team had a 108 OPS+. In 1985, the Royals produced nothing better than a 95 OPS+.

Game 4: This series evens at two  games each as the 1985 team’s 118 staff ERA+ easily beats 1980’s 105.

Game 5: Behind Brett, the 1980 Royals had a 44.9 WAR. The 1985 world champs got their WAR to 39.6. Not good enough.

Game 6: The 1980 Royals’ .978 fielding average matched the league average. The 1985 Royals fielded .980, one point better than the league average.

Game 7: Each team produced just one Hall of Famer, Brett. That sends the series to a Game 7  tie-breaker, which is decided on the basis of All Star selections. The 1985 team produced just one selectee, Brett. The 1980 team fielded three: Brett, Gura, and catcher Darrell Porter.

Result: 1980 in seven games
(Photo by Rich Pilling/Getty Images)
(Photo by Rich Pilling/Getty Images) /

1977 vs. 1980

The fight for the honor of the best team in Kansas City Royals history comes down to a battle of the Nos. 3 and 5 seeds, neither of whom won a World Series.

More Royals. Rebuild brings opportunities for McBroom. light

Game 1: In 1977, the Royals went 102-60 for a franchise-best .630 percentage. That’s five games better than in 1980.

Game 2: The 1980 team had a .555 post-season percentage, beating New York in an ALCS sweep before losing to the Phillies in six. The 1977 team lost the ALCS to New York in five games.

Game 3: The 1977 team’s 109 OPS+ is the franchise’s best ever, one point ahead of 1980’s 108.

Game 4: The 1977 team also had the better pitching. Its 115 ERA+ is 10 points higher than 1980’s 105.

Game 5: The 1980 Royals had a 44.9 team WAR. That’s only average for a champion, and not enough to prevent 1977 (51.0) from closing out the series.

Result: 1977 in five games

Largely due to its post-season frustrations – typical of the Kansas City Royals in those days – the 1977 club is often overlooked. It was, in fact, a powerhouse, compiling a record that was the majors’ best. It ran afoul of the dictum that in a short post-season series anything can happen, and lost to the Yankees, who went on to win the World Series.

Royals 2020 preview and predictions. dark. Next

But for that three-run rally in the top of the ninth inning of the fifth ALCS game, we might today be fondly recalling the 1977 Royals’ world championship and celebrating them as the best Royals team ever.

Next