Minnesota Twins: The franchise all-time bracket

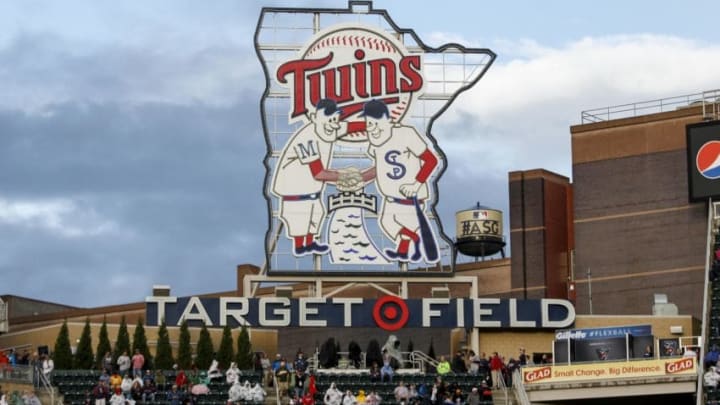
MINNEAPOLIS, MN - JULY 14: The Target Field sign stands in front of a water tower with the All-Star Game logo on it during the Gillette Home Run Derby at Target Field on July 14, 2014 in Minneapolis, Minnesota. (Photo by Bruce Kluckhohn/Minnesota Twins/Getty Images)
5 of 7
Next
Nelson Cruz of the Minnesota Twins. (Photo by Jim McIsaac/Getty Images)
Nelson Cruz of the Minnesota Twins. (Photo by Jim McIsaac/Getty Images) /

The Minnesota Twins franchise has produced three World Series winners. But it also has a long recent history of post-season failures.

The Minnesota Twins began life as the Washington Senators, an original American League franchise. With rare exceptions, those Senators were awful, winning just three pennants in six decades of play.

Since moving to the Twin Cities in 1961, the Twins have fared better. Thirteen teams representing Minnesota have played in the post-season, two winning the World Series and a third getting to the Fall Classic.

More from Call to the Pen

Since the last World Series title in 1991, however, the Twins have become more or less notorious for post-season frustration. Since then, eight Twins teams have qualified for post-season play, but their combined post-season record shows only six victories, none since 2004. With their 2019  ALDS sweep at the hands of the Yankees, Minnesota’s post-season losing streak has reached 16 games.

Selection of contenders for an all-time Senators-Twins bracket obviously begins with the franchise’s three World Series winners, those being the champions of 1924, 1987 and 1991. Two of the three teams that played in and lost the World Series – the 1933 Senators and 1965 Twins – should also be included.

There is no particular reason to select the third World  Series loser, the 1925 Senators. They are a clone of the 1924 World Series winners, and leaving them out will allow greater flexibility to select more recent entries.

With those five teams in the field, we have room for three recent entries. Between 2002 and 2006, four Twins teams qualified for post-season play, of which the 2006 club had the best post-season record. It’s in.

Only two teams in franchise history won 100 games, one being the 2019 Twins, who hit 101 in winning the AL Central. That’s good enough to get them in the field. The final spot goes to the 1970 Twins, a divisional winner that featured Rod Carew, Tony Oliva, and Harmon Killebrew.

The format is identical to previous bracket challenges. Each matchup in the tournament is decided based on seven criteria. You can think of each as a ‘game,’ the winner of four games advancing. The seven criteria are:

  1. Game 1: Regular season winning percentage.
  2. Game 2: Post-season winning percentage
  3. Game 3: Team OPS+
  4. Game 4: Team ERA+
  5. Game 5 (if necessary): Team WAR
  6. Game 6 (if necessary: Fielding percentage above the league average for the season in question.
  7. Game 7 (if necessary): Hall of Famers or likely future Hall of Famers
Tony Oliva, star of the 1965 Minnesota Twins. (Photo by Focus on Sport/Getty Images)
Tony Oliva, star of the 1965 Minnesota Twins. (Photo by Focus on Sport/Getty Images) /

Minnesota Twins: The Franchise All-Time Bracket

No. 1 vs. 8 seed

The 1965 Twins were the winningest team in franchise history, coming away with 102 victories against just 60 losses. That  Twins team lost a memorable seven-game World Series to the Los Angeles Dodgers of Sandy Koufax, Don Drysdale, and Claude Osteen.

The 1965 Twins were led by Oliva, at .321 with 98 RBIs, and Killebrew, who hit 25 home runs.

But it was the pitching staff, led by Mudcat Grant and Jim Kaat, that carried the team. Grant went 21-7 with a 3.30 ERA in 39 starts while Kaat’s 18-11 record encompassed 42 starts. In the bullpen, veteran Al Worthington saved 21 games and won 10 more.

The 2006 Twins won the AL Central with 96 victories. Justin Morneau batted .321 and drove in 130 runs to win the MVP, while catcher Joe Mauer took the batting title with a .347 average. Morneau also hit 34 home runs and Torii Hunter had 31.

Johan  Santana went 19-6 on the mound with a 2.77 ERA in 34 starts. Joe Nathan piled up 36 saves.

Related Story. The all-time Kansas City Royals bracket. light

Game 1: The 1965 Twins’ .630 winning percentage is the best since the schedule was expanded to 162 games. The 2006 team’s regular-season record was 96-66, a .593 percentage.

Game 2: The 2006 team, of course, failed to win a  post-season game. The 1965 team’s seven-game World Series loss translates to a .429 post-season percentage.

Game 3: Neither team was offensively exceptional by the standards of its time. The 1965 team’s OPS+ was 100, exactly average for its era. The 2006 team beat that by one point at 101.

Game 4: Both staffs compiled a 114 ERA+. The tiebreaker is the highest individual ERA+ among the regulars. That goes to Santana of the 2006 team at 162; in 1965, Jim Perry had a 136 ERA+. This series is even at two games each.

Game 5: The 2006 Twins compiled 47.2 WAR, easily surpassing the  1965 champions’ 41.5.

Game 6: The 1965 Twins were, by the standards of their era, not especially talented in the field. Their .973 fielding percentage was five points below the AL average of .978. The 2006 Twins fielded .986, two points above the league average. This series ends in a major 8 over 1 upset.

Result: 2006 Twins in six games

(Photo by Mark Rucker/Transcendental Graphics, Getty Images)
(Photo by Mark Rucker/Transcendental Graphics, Getty Images) /

Minnesota Twins: The Franchise All-Time Bracket

No. 4 vs. 5 seed

The 1924 Senators were the franchise’s first World Series team, winning a memorable seven-game series from the New York Giants. Begin with  Walter Johnson, 36, who went 23-7 in 38 starts and pitched 278 innings. Johnson also won the decisive seventh game in relief.

The staff’s 3.34 EWRA was the league’s best.

The regular lineup was led by its Hall of Fame corner outfielders. In left, Goose Goslin batted .344 with 129 RBIs. In right, Sam Rice hit .334. First baseman Joe Judge added a .324 average.

The Senators won despite finishing last in the majors in home runs, hitting just 22. Goslin hit 12 of them.

In stark contrast with 1924, the 2019 Twins were famous for their power. They hit an all-time record 307 home runs, led by DH Nelson Cruz with 41. In fact, seven members of the 2019 Twins hit more home runs than the entire 1924 World Championship team. In addition to Cruz, those seven included Max Kepler (36), Miguel Sano (34), Eddie Rosario (32), Mitch Garver (31), C.J. Cron (25), and Jonathan Schoop (23),

The 2019 pitching staff was versatile, but not star-laden. Jake Odorizzi led in wins with 15, and Jose Berrios in innings pitched with 200.

Related Story. Cleveland Indians: The franchise all-time bracket. light

Game 1: The 2019 team’s .623 percentage is good enough to put away 1924, which went 92-62 .597.

Game 2: An easy pickup for the World Champs against a team that failed to win a post-season game.

Game 3: Given all those home runs hit by the 2019 team, this one has to go to the sluggers, right? Right. The 2019 Twins had a team 117 OPS+; in 1924, the Senators were sub-par offensively, registering only a 94 OPS+.

Game 4: Another assumption: 1924, led by Johnson, must have the pitching edge, right? Right again. That team’s 122 ERA+ is superior to the 2019 team’s 110.

Game 5: The 2019 Twins ran up a 49.7 WAR. That’s just good enough to beat out the 1924 team’s 48.8 WAR.

Game 6: The 2019 Twins fielded .981, two points worse than the league average. In 1924, the Senators fielded .972, but that was three points better than the league average.

Game 7: At this early stage of most of their careers, it is virtually impossible to know how many of the 2019 Twins, if any, may reach enshrinement in Cooperstown. Berrios, Kepler, Garver. Rosario, Polanco, Buxton, and Sano all have too much of their resumes yet-unwritten. But we do know about 1924, a team that featured four Hall of Famers: Johnson, Goslin, Rice, and player-manager Bucky Harris. It would be a big ask to get four members of the 2019 Twins roster to that exalted status.

Result: 1924 Senators in seven games

Bert Blyleven pitches during the 1987 World Series. (Photo by Ron Vesely/MLB Photos via Getty Images)
Bert Blyleven pitches during the 1987 World Series. (Photo by Ron Vesely/MLB Photos via Getty Images) /

Minnesota Twins: The Franchise All-Time Bracket

No. 2 vs. 7 seed

Until 2019’s Nationals, the 1933 Senators were the last Washington-based pennant winner. While not a great team, this club did win 99 games. It featured a deep offense led by outfielder  Heinie Manush (.336, 95 RBIs), shortstop-manager Joe Cronin (.309, 118  RBIs), first baseman Joe Kuhel (.322, 107 RBIs), and second baseman Buddy Myer (.302). The club’s .287 batting average led the American League.

The pitching staff was not memorable, but Alvin ‘General’ Crowder did pile up 24 wins in 299 innings.

The 1987 Twins famously won the World Series by never losing a post-season game at their home facility, the Metrodome. The seven-game World Series with St. Louis, the Twins were out-scored 14-5 in three games in St. Louis but won all four games at the Dome by a total of 33-12.

Center fielder Kirby Puckett led the offense at .332 with 28 homers and 99 RBIs. Gary Gaetti added 109 RBIs and first baseman Kent Hrbek produced 34 home runs.

Bert Blyleven and Frank  Viola led the pitchers with a combined 32-22 record in 73 starts encompassing 519 innings.

Jeff Reardon saved 31 games.

Chicago White Sox: The franchise all-time bracket. light. Related Story

Game 1: The 1933 Senators went 99-5, a .651 percentage that is the best in franchise history. The 1987 team was only marginally more than ordinary during the regular season, as its 85-77 .525 percentage shows.

Game 2: The 1987 Twins had a .667 post-season percentage, far better than the 1933 Senators’ .200.

Game 3: Measured by OPS+, the 1933 Senators were better. They had a 101 score, while the 1987 team managed nothing more than 97.

Game 4: The 1987 Twins were also ordinary on the mound. Their 99 ERA+ does not keep up with the 1933 team’s 109.

Game 5: The 1933 Senators amassed a 47.0 WAR. Despite Puckett, Hrbek, and Gaetti, the 1987 Twins only got to  30.7.

Result: 1933 in five games

Kirby Puckett celebrates walk-off HR in Game 6 of the 1991 World Series. (Photo by Focus on Sport/Getty Images)
Kirby Puckett celebrates walk-off HR in Game 6 of the 1991 World Series. (Photo by Focus on Sport/Getty Images) /

Minnesota Twins: The Franchise All-Time Bracket

No. 3 vs. 6 seed

The 1991 Twins capped a thrilling season with a seven-game World Series victory over the Atlanta Braves, winning the seventh game 1-0 behind Jack Morris’ 10-inning shutout. It was one of the classic games in baseball history.

During the regular season, Puckett hit .319 to lead the team while DH Chili Davis added 29 home runs and 93 RBIs.

Morris was 18-12 in the regular season but went 4-0 in that post-season with a 2.23 ERA. Scott Erickson was 20-8.

The 1970 Twins presented a  deep offensive cast led by Carew (.366 in an injury-marred year), and Oliva (.325). Killebrew hit 41 home runs and drove in 113, while Oliva added 107.

Jim Perry’s 24-12 record led the pitchers. Perry made 40 starts and pitched 279 innings.

Related Story. St. Louis Cardinals: The franchise all-time bracket. light

Game 1: The 1970 team went 98-64 for a .605 regular-season percentage. The 1991 champs went 95-67, three games worse.

Game 2: The 1991 team had a .667 post-season record. The 1970 Twins lost a three-game ALCS to Baltimore without a win.

Game 3: The Oliva-Carew-Killebrew Twins still managed only a 98 OPS+. That won’t keep up with the 1991 Twins’ 107 OPS+.

Game 4: In ERA+, the 1970 team was slightly superior. Its staff total was 118, two points better than the Morris-led 1991 Twins.

Game 5: The 1991 Twins had a 50.5 WAR. That’s a franchise high, and easily beats the 1970 team’s 44.8 WAR.

Game 6: In 1991, the Twins fielded .985, four points better than the AL average. In 1970, the Twins fielded .980. That beat the AL average by two points…good, but not good enough.

Result: 1991 in six games
Joe Mauer of the Minnesota Twins (Photo by Brace Hemmelgarn/Minnesota Twins/Getty Images)
Joe Mauer of the Minnesota Twins (Photo by Brace Hemmelgarn/Minnesota Twins/Getty Images) /

Minnesota Twins: The Franchise All-Time Bracket

2006 vs. 1924

The 2006 Twins shockingly eliminated the top-seeded 1965 club, and now take on one of the franchise’s three World Series winners.

Game 1: The 1924 Senators were 92-62 in the regular season, a .597 percentage. The 2006 Twins were 96-66, a .593 percentage.

Game 2: The 1924 World Champs put away a team that failed to win a post-season game.

Game 3: The 1924 Senators only managed an unimpressive 95 OPS+. In 2006, the Twins got to 101.

Game 4: The 2006 Twins had a staff 114 ERA+. As excellent as that is, it doesn’t keep up with the 1924 Senators’ 122 ERA+.

Game 5: The 1924 Senators compiled a 48.8 WAR. In 2006, the Twins had a team WAR of 47.2.

Result: 1924 in five games

Related Story. Pittsburgh Pirates: The franchise all-time bracket. light

1933 vs. 1991

Game 1: The 1933 Senators were 99-53 .651. That’s a franchise high. The 1991 team’s 95-67. .586 isn’t good enough.

Game 2: Based on post-season winning percentage, 1991 evens this series. Its .667 percentage easily beats 1933’s .200.

Game 3: The 1933 Senators had a 101 team OPS+. That’s just one point above average, and it won’t keep up with 1991’s 107 OPS+.

Game 4: The 1991 Twins had a 116  staff ERA+. Pitching was not a strength of the 1933 team, which only got to a 109 ERA+.

Game 5: The 1991 Twins amassed a 50.5 team WAR. That’s a franchise-best, beating 1933’s 47.0 WAR.

Result: 1991 in five games

Twins manager Tom Kelly with the 1991 World Series trophy. (Photo by Rich Pilling/Getty Images)
Twins manager Tom Kelly with the 1991 World Series trophy. (Photo by Rich Pilling/Getty Images) /

Minnesota Twins: The Franchise All-Time Bracket

1924 vs. 1991

Two of the franchise’s three World Series winners go head-to-head.

More from Minnesota Twins

Game 1: The 1924 Senators’ .597 regular-season percentage is just one game better than the 1991 team’s .586.

Game 2: Both teams won the World Series. The 1924 team did so in seven games with a .571 percentage. The 1991 team also won a seven-game World Series, but it benefitted from having also won an ALCS in five games. Its post-season percentage is .667.

Game 3: With the series tied at a game each, we shift to performance characteristics. The 1991 team’s OPS+ was 107. That’s easily better than the 1924 team’s 95 OPS+.

Game 4: In ERA+, the 1924 team soared to 122 behind Johnson. The 1991 Twins had a laudable 116 ERA+, but that’s not good enough. That ties this championship series at two games each.

Game 5: In 1991,  the Twins had a 50.5 WAR, a franchise-best. The 1924 Twins had a 48.8 WAR.

Game 6: The 1924 team fielded well for its era, with a .972 percentage that beat the AL average by three points. The 1991 team fielded .985, and that was four points better than the AL average.

dark. Next. April 6-9 AL sim: Here come the Yankees

Result: 1991 in six games

In beating the 1970, 1933 and 1924 teams, the 1991 Twins were never taken to a seventh game, counting Hall of Famers. For the record, they had two immortals, outfielder Kirby Puckett and pitcher Jack Morris.

Next