Detroit Tigers: The Franchise All-Time Bracket

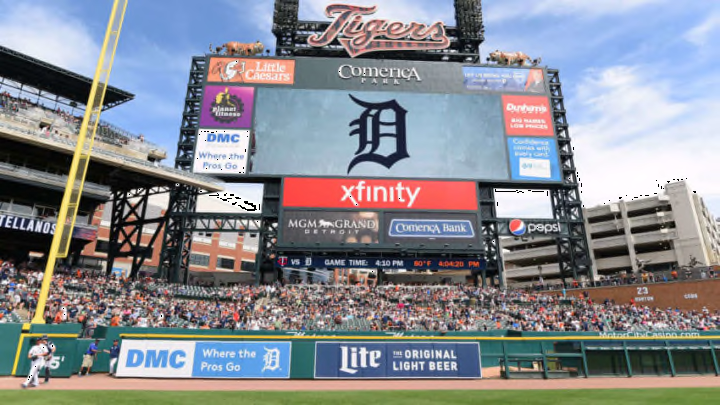
DETROIT, MI - JUNE 08: A general view of the Comerica Park scoreboard prior to the game between the Detroit Tigers and the Minnesota Twins at Comerica Park on June 8, 2019 in Detroit, Michigan. The Tigers defeated the Twins 9-3. (Photo by Mark Cunningham/MLB Photos via Getty Images)
2 of 7
Next
Detroit Tigers pitcher Justin Verlander. (Photo by Dave Reginek/Getty Images)
Detroit Tigers pitcher Justin Verlander. (Photo by Dave Reginek/Getty Images) /

The Detroit Tigers have presented such immortals as Ty Cobb, Hank Greenberg, Al Kaline, and Miguel Cabrera. But can any of them beat that 1984 team?.

Since the franchise’s creation in 1901, the Detroit Tigers have won four World Series and played in seven others.

The Tigers have also fielded some of the game’s legendary figures. Ty Cobb was a Tiger for virtually the entirety of his career. Al Kaline never wore any other uniform. Hank Greenberg became a Tiger legend in the 1930s and 1940s.

More from Call to the Pen

The franchise history is dotted with Hall of Famers of the stripe of Alan Trammell, Harry Heilmann, Charlie Gehringer, and Wahoo Sam Crawford. In recent years, dominant players such as Justin Verlander, and Miguel Cabrera have carried the Tigers to the brink of ultimate success.

An all-time Tigers bracket, then, embraces the full scope of MLB history.

Filling out that bracket begins with the four world championship teams, the Tigers of 1935, 1945, 1968 and 1984. The Cobb-led Tigers, three-time pennant winners between 1907 and 1909, deserve an entry, and since the 1909 team is by record the best of that bunch, it gets the fifth spot.

For the final three berths, we can choose from among nine post-season qualifiers from various eras. At least one spot ought to be allocated to one of the four consecutive AL Central division winners between 2011 and 2014. The 2011 club had the best record from among those four, and thus, is the logical choice. The 2006 American League champion represents an era that is not already in the field.

With 1909, 1935, 1945, 1968, 1984, 2006 and 2011 included, the final selection should go to the best remaining Tiger team. There are five candidates, the World Series losers of 1907, 1908, 1934, 1940 and  2012. Of those, the 1934 Tigers – with a .656 winning percentage – stand head and shoulders above the rest.

The format is identical to previous bracket challenges. Each matchup in the tournament is decided based on seven criteria. You can think of each as a ‘game,’ the winner of four games advancing. The seven criteria are:

  1. Game 1: Regular season winning percentage.
  2. Game 2: Post-season winning percentage
  3. Game 3: Team OPS+
  4. Game 4: Team ERA+
  5. Game 5 (if necessary): Team WAR
  6. Game 6 (if necessary: Fielding percentage above the league average for the season in question.
  7. Game 7 (if necessary): Hall of Famers or likely future Hall of Famers
Detroit Tigers star Miguel Cabrera. (Photo by Rich Schultz/Getty Images)
Detroit Tigers star Miguel Cabrera. (Photo by Rich Schultz/Getty Images) /

Detroit Tigers: The Franchise All-Time Bracket

No. 1 vs. 8 seed

The 1984 Tiger team was one of the dominant ballclubs of any era. Winning 35 of its first 40 games, Sparky Anderson’s club laughed to the AL East title by 15 games over Toronto, brushed aside the Kansas City Royals in three games in the ALCS, then finished off the National League champion San Diego Padres in five World Series games.

The Tigers’ secret was pitching. The 3.49 team ERA easily led the American League. Jack Morris and Dan Petry combined for 37 wins, and closer Willie Hernandez won both the Cy Young and MVP with 32 saves and a 1.92 ERA I 80 appearances totaling 140 innings.

Offensively, the Tigers had Trammell (.314) at short and Kirk Gibson (91 RBIs, 29 steals) providing a rare combination of power and speed.

The 2011 Tigers won 95 regular-season games and beat New York in a division series but lost a tough ALCS in six games to Texas. Cabrera, Verlander, and pitcher Max Scherzer were the stars. Verlander and Scherzer combined for 39 wins in 67 starts encompassing 446 innings. Jose Valverde saved 49 games.

Cabrera was the scourge of the American League, presaging his 2012 triple crown season with 30 homers, 105 RBIs and a .344 average, good for the firsts of four batting titles in five seasons. DH Victor Martinez added a .330 average and 103 RBIs.

Related Story. Minnesota Twins: The definitive franchise all-time bracket. light

Game 1: The 1984 team’s .642 regular-season winning percentage – built on a 104-58 record – is among the best of the last 50 years. The 2011 team went 95-67 .586.

Game 2: The 1984 Tigers showed their true class in post-season, winning seven of eight games and allowing just 19 runs in the process. The 201`1 club went 5-6 .455 in post-season.

Game 3: The deep and balanced 1984 Tigers produced a 114 team OPS+. Even with Cabrera sitting at 179, the 2011 team could do no better than 109.

Game 4: Morris, Petry, and Hernandez led the 1994 Tigers to a staff ERA+ of 113. The 2011 club’s staff ERA+ was 103.

Result: 1984 in four straight
(Photo Reproduction by Transcendental Graphics/Getty Images)
(Photo Reproduction by Transcendental Graphics/Getty Images) /

Detroit Tigers: The Franchise All-Time Bracket

No. 4 vs. 5 seed

The 1945 Detroit Tigers won the final war-time World Series, benefitting from the early return to civilian life of the team’s hitting star, Hank Greenberg. Returning in July, Greenberg batted .311 over the season’s final half, with 13 home runs and 60 RBIs.

Hall of Fame pitcher Hal Newhouser went 25-9 with a 1.81 ERA in 35 starts and 313 innings. The Tigers got past the Chicago Cubs in the seven-game World Series.

The 1934 Tigers went 101-53 for a .656 percentage before losing to the St. Louis Cardinals Gashouse Gang in seven games. Greenberg was only 23 and in his peak, hitting .339 with 26 homers and 139 RBIs. Gehringer batted .356 and drove in 127, and outfielder Goose Goslin gave the team a third 100 RBI man. Six Tiger regulars topped .300 that season.

Those Tigers could pitch, too. Tommy Bridges and Schoolboy Rowe combined for 46 wins in 540 innings.

light. Related Story. The all-time Kansas City Royals bracket

Game 1: The 1934 club’s .656 bests 1945’s 88-65 .575 regular-season percentage.

Game 2: In post-season, the 1945 team’s seven-game World Series win produces a .571 percentage, the exact opposite of the 1934 team’s seven-game loss for a .429 post-season percentage.

Game 3: With Greenberg, Gehringer, Goslin and their cohorts banging away, the 1934 team ran up a 106 OPS+. The 1945 team managed only a 93.

Game 4: Newhouser carried the 1945 Tigers to a 119  staff ERA+, easily good enough to top the Bridges-Rowe Tigers, who topped out at 108. This series is even at two games each.

Game 5: The 1945 club produced a 34.5 WAR. That’s low by championship standards, and it certainly can’t keep up with the 1934 team’s 50.8 WAR.

Game 6: The 1934 Tigers fielded .974, three points better than that season’s American League average. The 1945 Tigers fielded .975, but that was only two points better than the AL average.

Result: 1934 in six games

(Photo by Focus on Sport/Getty Images)
(Photo by Focus on Sport/Getty Images) /

Detroit Tigers: The Franchise All-Time Bracket

No. 2 vs. 7 seed

The 1968 Detroit Tigers are legendary due to the feats of one man, pitcher Denny McLain. That was the season McLain became baseball’s last 30-game winner, going 31-6 with a 1.96 ERA in 41 starts and 336 innings.

McLain was ably abetted by left-hander Mickey Lolich, who followed his 17-9 regular season with three World Series victories. In the decisive seventh game, Lolich – working on two days rest – beat Bob Gibson and the Cardinals 4-1.

Offensively, the Tigers were mediocre except where it counted, in runs scored. They led the AL in that category and were the only team to average more than four runs per game.  They only gave up three runs per game, a league-low.

The 2006 Tigers entered post-season play as a wild card team but beat New York and Oakland – the latter in four straight —to reach the World Series against St. Louis. There an odd problem – the inability of their pitchers to field the ball – did them in. Tiger hurlers made four errors allowing seven unearned Cardinal runs to score and they lost in five games.

During the regular season, shortstop Carlos Guillen hit .320 and catcher Ivan Rodriguez batted .300. Outfielder Magglio Ordonez hit 24 homers and drove in 104 runs.

Related Story. Cleveland Indians: The franchise all-time bracket. light

Game 1: The 1968 Tigers went 103-59 for a .636 percentage, significantly better than the 2006 clubs 95-67 .586.

Game 2: The 1968 Tiger team was the last World Series winner that did not have to go through a qualifying series. But until their World Series fumbles, the 2006 Tigers played well in post-season, winning seven of eight pre-World Series games. That gave them a .615 post-season percentage.

Game 3: In an offensively challenged season, the 1968 Tigers managed to produce a 107 OPS+. The 2006 Tigers were ordinary at the plate, as their 99 OPS+ shows.

Game 4: The 2006 team’s 188 staff ERA+ puts away the 1968 club’s 111 and evens the series at two games each. Because I know you’re wondering,, McLain’s ERA+ in 1968 was 154.

Game 5: The 1968 Tigers compiled a 52.2 team WAR. That’s good enough to beat the 2006 team’s 47.3 WAR.

Game 6: Both teams fielded .983. But the 1968 team was five points better than the league average; the 2006 team under-performed the league average by one point.

Result: 1968 in six games

(Photo by Rodin Eckenroth/Getty Images)
(Photo by Rodin Eckenroth/Getty Images) /

Detroit Tigers: The Franchise All-Time Bracket

No. 3 vs. 6 seed

The 1935 Detroit Tigers were a clone of the 1934 club with one vital exception: they won the World Series.

Greenberg hit .328 in 1935 with 36 homers and 168 RBIs, Gehringer topped out at .330 and 108 RBIs, and Goslin drove in 111. (If you’re wondering, yes, their collective nickname was ‘the G Men.’) Catcher-manager Mickey Cochrane hit .319 and outfielder Pete Fox was good for .321.

Rowe and Bridges combined for 40 more wins across 550 innings, and Elden Auker went 18-7. The Tigers did not have a deep staff, but they didn’t need one: Between them, Bridges, Rowe, Auker, and General Crowder pitched 986 of the team’s 1,364 innings.

The 1909 Tigers were the best of the great early teams led by Cobb. He batted .377 that season, winning the batting title, and Crawford hit .314 in support. Cobb’s 216 hits and 107 RBIs were also league highs.

The Tigers featured five pitchers, with George Mullin (29-8, 2.22 ERA in 35 starts, 304 innings) leading the way. They lost the World Series to Pittsburgh in seven games.

Related Story. Chicago White Sox: The franchise all-time bracket. light

Game 1: the first game goes to the 1909 Tigers based on their 98-54 record, a .645 percentage. The 1935 team was 93-58 during the regular season, .616.

Game 2: The 1935 club won a six-game World Series, while the 1909 Tigers lost in seven.

Game 3: At 110, the 1935 club’s team OPS+ is deeper than the 1909 team’s 106.

Game 4: The 1909 team had the deeper pitching staff, and it showed in their 112 staff ERA+. That was three points better than 1935’s 109.

Game 5: Led by Greenberg, the 1935 team compiled 52.0 WAR. The Cobb-led 1909 team only got to 49.3 WAR.

Game 6: The 1909 Tigers fielded .959, two points better than the league average. The 1935 team was exceptional with the glove, recording a .979 fielding average. That was seven points superior to that season’s American League average.

Result: 1935 in six games

(Photo Reproduction by Transcendental Graphics/Getty Images)
(Photo Reproduction by Transcendental Graphics/Getty Images) /

Detroit Tigers: The Franchise All-Time Bracket

1984 vs. 1934

Game 1: The 1934 Detroit Tigers went 101-53, a.656 regular-season percentage. The 1984 Tigers won three more games, but they played eight more. Their percentage was .642, giving the win to 1934.

Game 2: With a .875 post-season percentage, the 1984 team dominates this category.

Game 3: The 1984 Tigers hit for a 114 team OPS+. In 1934, the Greenberg-led Tigers got to 106, good but not good enough.

Game 4: Another win for the dominant 1984 team. Their 113 staff ERA+ is five points better than 1934’s 108.

Game 5: More evidence that the 1984 club is the franchise’s most dominant. Their 51.8 WAR edges out 1934’s very good 50.8 WAR by one point. The difference comes down to depth: The 1934 team carried 13 players who produced a negative WAR; in 1984, only six Tigers went negative.

Result: 1984 in five games

Related Story. St. Louis Cardinals: The franchise all-time bracket. light

1968 vs. 1935

This is a battle of two World Series winners from vastly different eras, one pitching-dominated and the other offensively focused’

Game 1: The 1968 Tigers had a .636 regular-season winning percentage, 20 points better than the 1935 champions.

Game 2: The 1935  team won its World Series in six games, taking one less loss than the 1968 champions. The series is even through two games.

Game 3: The 1935 champs had a 110 OPS+, topping the 1968 team’s 107 by three points.

Game 4: As expected, the pitching category goes to 1968 with its 111 staff ERA+. The 1935 team maxed out at 109.

Game 5: A nail-biter. The 1968 Tigers wound up at 52.2 WAR, fractionally superior to 1935’s 52.0.

Game 6: The 1935 team was superior with the glove. At .979, it fielded seven percentage points above the league average. Thank Gehringer, Cochrane and center fielder JoJo White for that. The 1968 team’s .983 fielding average was five points above the league average. That’s very good, but not good enough.

Game 7: This series comes down to Hall of Famers. The 1968 team rostered two, Kaline and Eddie Mathews, a 36-year-old pinch hitter and fill-in infielder at the time The 1935 Tigers were led by Hall of Famers Greenberg, Cochrane, and Gehringer…just enough to win.

Result: 1935 in seven games

Alan Trammell, star of the 1984 Detroit Tigers. (Photo by Ronald C. Modra/Getty Images)
Alan Trammell, star of the 1984 Detroit Tigers. (Photo by Ronald C. Modra/Getty Images) /

Detroit Tigers: The Franchise All-Time Bracket

Championship

The 1935 Detroit Tigers present one of the deepest lineups in franchise history, led by Cochrane, Gehringer, Greenberg, and Goslin in the middle. With Rowe and Bridges leading the way, they can also pitch.

More from Detroit Tigers

The 1984 club lacks the Hall of Fame level names, but it is an extremely deep roster laden with players – Gibson, Jack Morris, Hernandez – who had career seasons.

Game 1: The 1984 team went 104-58f for a .642 percentage. The 1935 team had a 93-58 regular season, a .616 percentage.

Game 2: Another win for 1984. Those Tigers swept through eight postseason games with seven wins., a .875 percentage. The 1935 team won four of six, a .667 percentage.

Game 3: In 1984 the Tigers had a 114 OPS+. As deep as the 1935 Tigers were, they only reached 110 OPS+.

Game 4: Morris and Hernandez led the 1984 staff to a 113 EA+. The 1935 Tigers of Rowe and Bridges got to 109. This series is a clean sweep.

Result: 1984 in four games

In three series, the 1984 Tigers were never taken to a sixth or seventh game. It’s a good thing for them that they weren’t because they were at best ordinary in those two areas. The team’s .979 fielding average only matched the American League average that season.

Next. MLB: Showcasing the Nastiest Pitches of All-Time. dark

And for all the talent on that 1984 team, it has only produced two Hall of Famers, those being Trammell and Morris. That is unless you count the team’s Hall of Fame manager, Anderson.

Next