Atlanta Braves: The franchise all-time bracket

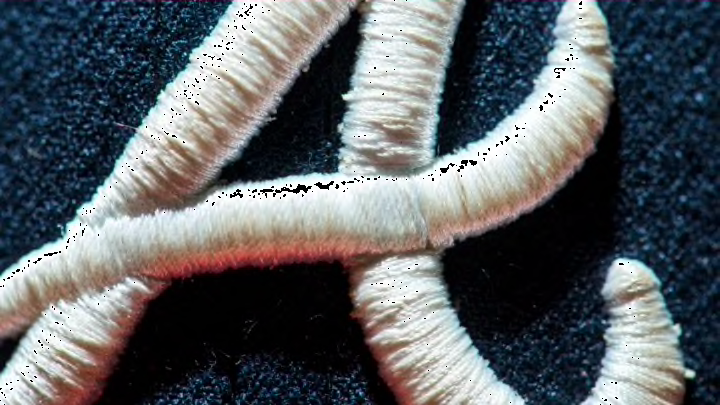
ATLANTA, GA - AUGUST 27: A detail view of the Atlanta Braves logo before the game against the Cleveland Indians at Turner Field on August 27, 2013. The Braves won 2-0. (Photo by Pouya Dianat/Atlanta Braves/Getty Images)
5 of 7
Next
(Photo by Scott Cunningham/Getty Images)
(Photo by Scott Cunningham/Getty Images) /

The teams of the 1990s face the Aaron-Mathews Atlanta Braves for franchise supremacy. Who will take the grand prize? Let’s take a closer look.

At first, glance, filling out an all-time Atlanta Braves bracket appears to amount to selecting the best teams from the 1990s dynasty.

After all, what team could surpass some of those Maddux-Glavine-Smoltz teams for consistent, unending performance?

More from Call to the Pen

The Braves did have that string of 14 division championships in a 15-year span –broken only by the 1994 strike. During that stretch the Braves six times won at least 100 games for manager Bobby Cox.

But the Braves, whether playing in Atlanta, Milwaukee or Boston, have had some other good teams as well. Only one of the franchise’s three World Championships came during that period. The 1914 and 1957 World Series winners also must be included.

Although the performance of the 1990s Braves teams is largely interchangeable, it makes sense to include the 1991, 1995 1998, and 2002 clubs both for their success and for the chronological spread they provide.  Taking them plus the 1914 and 1957 teams leave room for two supplemental representatives, the 1948 National League champions and 2019 NL East champions being the most representative.

So that’s our bracket.

Related Story. Atlanta Braves 2020 Preview, Predictions. light

The format is identical to previous bracket challenges. Each matchup in the tournament is decided based on seven criteria. You can think of each as a ‘game,’ the winner of four games advancing. The seven criteria are:

  1. Game 1: Regular season winning percentage.
  2. Game 2: Post-season winning percentage
  3. Game 3: Team OPS+
  4. Game 4: Team ERA+
  5. Game 5 (if necessary): Team WAR
  6. Game 6 (if necessary: Fielding percentage above the league average for the season in question.
  7. Game 7 (if necessary): The standard for Game 7 is Hall of Famers or likely future Hall of Famers.
Lonnie Smith of the 1991 Atlanta Braves. (Photo by Ron Vesely/MLB Photos via Getty Images)
Lonnie Smith of the 1991 Atlanta Braves. (Photo by Ron Vesely/MLB Photos via Getty Images) /

Atlanta Braves: The All-Time Bracket

No. 1 vs. 8 seed

Despite the quality of the 1990s era teams, the 1957 Braves probably deserve the top seed. That championship club had Hank Aaron (.322, 44, 132), Eddie Mathews (.292, 32, 94), and Red Schoendienst (.310).

On the mound, Warren Spahn, Lew Burdette, and Bob Buhl were about as dominant as Maddux, Glavine or Smoltz, They combined for a 56-27 record in 99 starts and 743 innings.

The 1991 Braves are a powerful eighth seed. Losers of a memorable seven-game World Series to the Minnesota Twins, third baseman Terry Pendleton batted .319 with 22 homers and 86 RBIs, and was named the National League’s Most Valuable Player. Ron Gant drove in 105 runs with 32 home runs.

The pitching staff featured Glavine (20-11, 2.55) with Smoltz, Charlie Leibrandt and Steve Avery in supporting roles. Avery, enjoying the best season of his brief career, was 18-8 in 35 starts.

San Diego Padres: The franchise all-time bracket. light. Related Story

Game 1: The 1991 Braves had a 94-68 regular-season record, good for a .580 percentage. In 1957 the Braves finished 95-59, a .617 percentage.

Game 2: The 1957 team had a .571 post-season percentage. In 1991 the Braves beat Pittsburgh in a seven-game NLCS before losing to Minnesota in seven, a .500 post-season percentage.

Game 3: The 1991 Braves had a 98 OPS+. In 1957, Aaron, Mathews, and Company produced a 111 OPS+.

Game 4: The 1957 Braves pitched to a 101 staff ERA+. In 1991 the Braves produced a 112 ERA+.

Game 5: The 1991 Braves produced 45.1 WAR. But the 1957 club rode Aaron’s 8.0 and Mathews’ 7.4 to a team 49.3 WAR.

Result: 1957 in five games

Freddie Freeman of the 2019 Atlanta Braves. (Photo by Mark Cunningham/MLB Photos via Getty Images)
Freddie Freeman of the 2019 Atlanta Braves. (Photo by Mark Cunningham/MLB Photos via Getty Images) /

Atlanta Braves: The All-Time Bracket

No. 4 vs. 5 seed

The 1998 Braves lost to San Diego in the NLCS after cruising to the NL East title by 18 games. Glavine was 20-6 with a 2.47 ERA, winning the Cy Young Award.  Maddux finished 18-9 and Smoltz 17-3, all three with ERAs under 3.00.

Chipper Jones hit.  .313 with 34 homers and 107 RBIs and first baseman Andres Galarraga provided 44 homers and 121 RBIs. Andruw Jones and Javy Lopez also topped 30 homers, Jones driving in 90 runs and Lopez 106.

In 2019 Freddie Freeman led the offense with a .295 average, 38 homers and 121 RBIs. But he had help from outfielder Ronald Acuna  (41 homers, 101 RBIs) and third baseman Josh Donaldson (37 homers, 94 RBIs).

Mike Soroka and Max Fried, a pair of young arms, emerged as stars, producing a combined 30-10 record in 59 starts.

Related Story. San Francisco Giants: The franchise all-time bracket. light

Game 1: The 1998 Braves were 106-56 in the regular season, a .654 percentage that is best in franchise history. The 2019 team was 97-65, a .599 percentage.

Game 2: In 1998 the Braves swept the Chicago Cubs in the division round but were upset in six games by the San Diego Padres. That’s a .555 post-season percentage. The 2019 team played .400 post-season ball.

Game 3: In 1998 the Braves’ offense produced a 107 OPS+. The 2019 team only got to a 99 OPS+.

Game 4: This series is a sweep for 1998. Its 128 staff ERA+ is far superior to 2019’s 109.

Result: 1998 in four games

(Photo by Hulton Archive Getty Images)
(Photo by Hulton Archive Getty Images) /

Atlanta Braves: The All-Time Bracket

No. 2 vs. 7 seed

The 1995 Braves won Atlanta’s first World Series, defeating Cleveland in six games. Maddux was 19-2, winning his fourth consecutive Cy Young. Glavine was 16-7, and Smoltz 12-7.

Lopez led the batting stats with a .315 average. First baseman Fred McGriff hit 27 home runs for 93 RBIs, and outfielder Ryan Klesko batted .310 with 23 homers and 70 RBIs.

The 1948 Braves are little recalled today, but they won the National League pennant by a comfortable six and one-half games over the St. Louis Cardinals. This was an offensive-minded team: second baseman Eddie Stanky batted .320, shortstop Alvin Dark hit .322, outfielder Tommy Holmes batted .325 and outfielder Jeff Heath hit .319.

Third baseman Bob Elliott provided the power with 23 homers and 100 RBIs.

That was the team made famous by “Spahn and Sain.” Together, Warren Spahn and Johnny Sain started 74 games, with a 39-27 record covering 572 innings. There was no Cy Young Award yet, but Sain finished second in Most Valuable Player voting to Stan Musial.

Related Story. Los Angeles Dodgers: The franchise all-time bracket. light

Game 1: The 1948 Braves’ 91-62 regular-season record works out to a .595 percentage. The 1995 team was 90-54, .625.

Game 2: In 1995 the Braves had a .786 post-season percentage. The 1948 team lost a six-game World Series to the Cleveland Indians.

Game 3: The 1995 team only managed a 91 OPS+. In 1948 the Braves had a 105 OPS+.

Game 4: The 1995 staff of Glavine-Smoltz-Maddux got to 123 in ERA+. The Spahn-Sain 1948 staff stopped at 115.  That gives 1995 a 3-1 lead.

Game 5: In 1948 the Braves produced 56.4 WAR. The 1995 team could do no better than 38.2

Game 6: Both teams fielded two points better than the league average. Carrying the decimals produced a slight edge for 1948. This series goes to a  seventh game.

Game 7: As deep as the 1948 team was, it has produced only one certified Hall of Famer, that being Spahn. The 1995 team had four Hall of Famers: Maddux, Glavine, Smoltz and Chipper Jones.

Result: 1995 in seven games

(Photo by Mark Rucker/Transcendental Graphics, Getty Images)
(Photo by Mark Rucker/Transcendental Graphics, Getty Images) /

Atlanta Braves: The All-Time Bracket

No. 3 vs. 6 seed

The 1914 ‘Miracle’ Braves famously came from last place on the Fourth of July to win the pennant…and then swept the heavily favored Philadelphia Athletics in the World Series.

The roster is heavily populated with obscurities who somehow came together under the leadership of manager George Stallings to work their magic. For the record, right-handers Dick Rudolph and Bill James, both enjoying the best seasons of their lives, combined for a 52-17 record with ERAs under 2.50. They also covered 669 innings.

Still, the sum was greater than its parts. The Braves finished only third in the league in both runs per game and runs allowed per game; they were third in batting average, fifth in slugging and last in stolen bases. Yet it somehow worked.

The 2002 Braves won 101 games and took the NL East by 19 games only to be upset in five games by the Giants in the division round.

Glavine and Maddux combined for a 34-17 record, while Smoltz – consigned to closer duty – saved 55 games.

Chipper Jones hit. 327 with 26 homers and 100 RBIs and outfielder Gary Sheffield added 25 homers plus 84 RBIs on a .307 average. Andruw Jones delivered 35 home runs and 94 RBIs.

Related Story. Arizona Diamondbacks: The all-time bracket. light

Game 1: The 1914 team was 26-40 at mid-season before closing with 68 victories in the final 87 games for a ..614 percentage. But the 2002 team was handicapped by no such sluggish start; it finished 101-59, a .631 percentage.

Game 2: The 1914 Braves’ four-game World Series sweep obviously translates to a perfect 1.000 post-season record. For the record, the 2002 Braves played  .400 post-season ball.

Game 3: The Miracle Braves won despite a 92 OPS+. The 2002 team was only one point better…but that’s enough.

Game 4: In 1914 the Braves produced a 104 ERA+. The 2002 team was deeper, as its 133 ERA+ illustrates.

Game 5: The 1914 Braves generated 35.9 WAR. But in 2002, the Braves had a 46.0 WAR, topped by the Jones boys, Andruw at 6.5 and Chipper at 5.8.

Result: 2002 in five games
(Photo by Jim McIsaac/Getty Images)
(Photo by Jim McIsaac/Getty Images) /

Atlanta Braves: The All-Time Bracket

The Semi-finals

The Braves bracket reaches the semi-final stage with the intimidating 1957 crew pitted against three representatives of the 1990s dynasty.

1957 vs. 1998

Game 1: The 1957 Braves were 95-59, a .617 regular-season percentage. In 1998, the Braves finished 106-56, a  .654 percentage.

Game 2: By winning a seven-game World Series, the 1957 team reached .571 in post-season performance. The 1998 club swept the Cubs in the division round but lost in six games to San Diego in the NLCS, a 5-4 record that works out to a .555 percentage. That’s a win for 1957.

Game 3: With Aaron at 166 and Mathews at 154, the 1957 Braves had a 111 OPS+. The 1998 team only got to 107.

Game 4: The 1998 Braves rise and fall on their pitching. The staff ERA+ was 128, far better than the 1957 club’s 101. The series is even at two games each.

Game 5: The 1957 Braves reached 49.3 WAR. But the 1998 Braves bettered that, at 55.9 WAR. They can thank Andruw Jones (7.4), Chipper Jones (7.1), Maddux (6.6) and Glavine (6.1)  for that advantage.

Game 6: The 1998 team fielded .985, four points better than the league average. The 1957 club fielded .981, also four points better. This game comes down to decimal points, and those favor 1998.

Result: 1998 in six games

Related Story. Colorado Rockies: The franchise all-time bracket. light

1995 vs. 2002

Game 1: The 2002 Braves won 101 games, and their .654 percentage was 29 points better than 1995’s .625.

Game 2: The 1995 Braves’ World Series win capped a .786 post-season. The 2002 team only played.400 post-season ball. The series is even at a game each.

Game 3: Based on OPS+, the 2002 team’s 93 was superior to 1995’s 91.

Game 4: The 2002 team also had statistically the better of it on the mound. Their 133 ERA+ beats 1995’s 123 by 10 points.

Game 5: In 2002 the Braves amassed a 46.0 WAR, easily better than 1995’s 38.2 WAR.

Result: 1998 in five games

Greg Maddux, star of the Atlanta Braves. (Mandatory Credit: Jamie Squire /Allsport)
Greg Maddux, star of the Atlanta Braves. (Mandatory Credit: Jamie Squire /Allsport) /

Atlanta Braves: The All-Time Bracket

The Championship

So the Atlanta Braves all-time bracket comes down to two great teams from the dynasty era, neither of which enjoyed post-season success, but both of which were dominant during the regular season.

More from Atlanta Braves

1998 vs. 2002

Game 1: The 1998 Braves won five more games, leading to a .654 percentage that is 23 points better than 2002’s .631.

Game 2: Both teams were post-season disappointments. But the 1998 Braves did manage a .555 post-season percentage. In 2002 the Braves were held to a .400 post-season percentage.

Game 3: The 1998 Braves’ 107 OPS+ was statistically superior to 2002’s 93.

Game 4: The 2002 Braves avoid a sweep with dominant pitching. Their 133 staff ERA+ is five points better than 1998’s 128.

Game 5: In 1998 the Braves generated 55.9 WAR. In 2002 they only got to 46.0

Result: 1998 in five games

Boston Red Sox: Steve Pearce going out in a blaze of glory. dark. Next

The 1998 Braves defeated the 2019, 1957 and 2002 teams without being taken to a seventh game To this point they have produced four Hall of Famers: Smoltz, Maddux, Glavine and Chipper Jones. That’s probably the limit, although there are those who argue for the candidacies of Andruw Jones or possibly someday Andres Galarraga.

Next