Philadelphia Phillies: The franchise all-time bracket

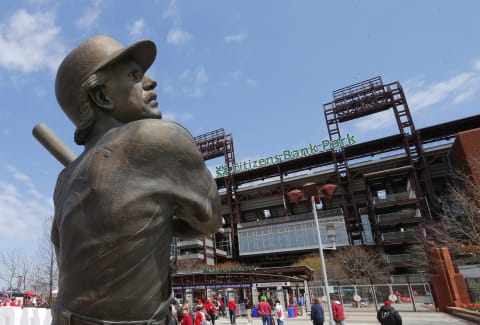
The 2008 and 1980 Philadelphia Phillies both won World Series. But neither may be the best team in Phillies franchise history. Let’s find out who is.
Historically the Philadelphia Phillies franchise has not been one of baseball’s best-performing. In 137 seasons of play, the Phillies have produced just two world champions, and the all-time franchise record is 275 games below .500.
Among the 15 current National League franchises, only three have a lower lifetime win percentage than Philadelphia.
More from Call to the Pen
- Philadelphia Phillies, ready for a stretch run, bomb St. Louis Cardinals
- Philadelphia Phillies: The 4 players on the franchise’s Mount Rushmore
- Boston Red Sox fans should be upset over Mookie Betts’ comment
- Analyzing the Boston Red Sox trade for Dave Henderson and Spike Owen
- 2023 MLB postseason likely to have a strange look without Yankees, Red Sox, Cardinals
In recent decades, however, the Phils have been more of a force. Their second World Series win, in 2008, highlighted a five-season stretch of consecutive division titles that was decidedly the best sustained period in the franchise’s history.
All-time the team has made 14 post-season appearances. Twelve of those 14 have come since 1976, five since 2007.
Formation of an all-time bracket begins with the 1980 and 2008 World Series winners and focuses on those big years between 1976 and 2011.
The 1976 and 1977 clubs both won 101 games; the 1977 team is included for its slightly better post-season record.
The 1983 team also won the National League pennant, losing to the Baltimore Orioles in a five-game World Series. Aside from the 2008 champions, the 2011 club was the best of the modern era. It set a franchise record with 102 regular-season victories.
The 1993 Phillies also reached the World Series, losing to the Toronto Blue Jays in six games.
Related Story. Phillies and team employees help fight COVID-19. light
The bracket’s final two spots go to the only two plausible representatives of the franchise’s first 90 seasons, the 1915 and 1950 pennant winners. Both represented isolated moments of glory to success-starved fans of earlier generations.
The format is identical to previous bracket challenges. Each matchup in the tournament is decided based on seven criteria. You can think of each as a ‘game,’ the winner of four games advancing. The seven criteria are:
- Game 1: Regular season winning percentage.
- Game 2: Post-season winning percentage
- Game 3: Team OPS+
- Game 4: Team ERA+
- Game 5 (if necessary): Team WAR
- Game 6 (if necessary: Fielding percentage above the league average for the season in question.
- Game 7 (if necessary): The standard for Game 7 is Hall of Famers or likely future Hall of Famers.
Philadelphia Phillies: The All-Time Bracket
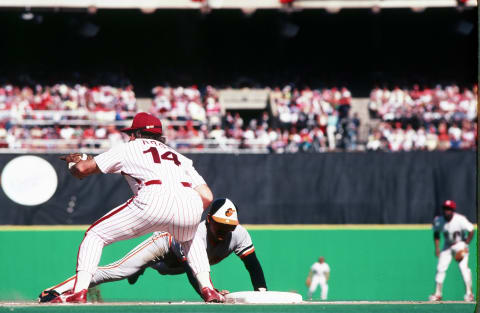
No. 1 vs. 8 seed
The 2008 team deserves the favorite’s mantle. Not only did they win a World Series at the height of the most sustained period of franchise excellence, but they also did so with a star-studded cast. First baseman Ryan Howard hit 48 home runs and drove in 146 runs, second baseman Chase Utley hit 33 homers and drove in 104, and shortstop Jimmy Rollins – coming off a 2007 MVP season – stole 47 bases.
Cole Hamels was the recognized staff ace with a 3.09 ERA in 33 starts. But 45-year-old Jamie Moyer delivered a 16-7 record and closer Brad Lidge added 41 saves.
The Phillies raced through the post-season largely untouched, winning all three rounds while never losing more than one game.
The 1983 club beat Pittsburgh by six games to take the NL East with a largely veteran cast enjoying one final fling before retirement. Steve Carlton was still around to lead the staff with a 3.11 ERA in 37 starts, although John Denny provided the best record, 19-6 and a 2.37 ERA. For that Denny was voted the Cy Young Award.
The lineup featured 42-year-old Pete Rose at first base, 39-year-old Joe Morgan at second, 33-year-old Mike Schmidt at third, 32-year-old Gary Matthews in left and 33-year-old Garry Maddox in center. In fact, the average age of the regulars was 34. Tony Perez, 41, filled in for Rose at first.
Schmidt for one could still play, delivering 40 homers and 109 RBIs. Catcher Bo Diaz added 15 homers and 64 RBIs. The Phillies polished off the Dodgers in four games in the NLCS before losing to the American League champion Baltimore Orioles in five.
Related Story. Toronto Blue Jays: The franchise all-time bracket. light
Game 1: The 1983 champions had a 90-72 record, good for a .556 percentage. The 2008 team was 91-71, a .562 percentage, one game better.
Game 2: The 2008 team had a .568 post-season percentage. The 1983 team’s post-season percentage was just .444. That’s a 2-0 series edge for 2008.
Game 3: In OPS+, the 2008 Phillies of Howard, Utley, and Rollins reached 99. Even with Schmidt, the 1983 Phillies only recorded a 96 OPS+.
Game 4: In 2008 the Phillies staff had a 112 ERA+. That’s four points better than the 1983 team’s 108.
Result: 2008 in four games
No. 4 vs. 5 seed
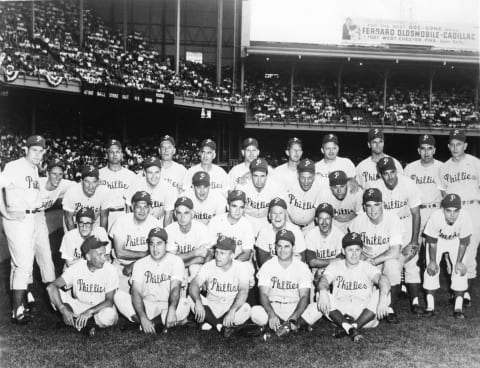
This pairing is a matchup of the two best teams of the franchise’s first nine decades, both now largely forgotten.
The 1915 Phillies were led by one of the greatest players of all time, pitcher Grover Cleveland Alexander. His numbers that season is worth savoring: a 31-10 record and 1.22 ERA in 42 starts, a dozen shutouts, 241 strikeouts, and 36 complete games.
As great as those numbers are, they might have been better. Seven of Alexander’s losses came in games in which he allowed two or fewer earned runs.
Erskine Mayer supported Alexander with a 21-15 record and 2.36 ERA.
The attack was not robust, but outfielder Gavvy Cravath provided occasional power, hitting 24 home runs and driving in 115.
The 1950 ‘Whiz Kids’ also relied heavily on an ace, in their case 23-year-old Robin Roberts. He was 20-11 in 39 starts with a 3.02 ERA. On the season’s final day, facing Brooklyn with the pennant on the line and working on just two days of rest, Roberts hurled a 10-inning complete-game decided on Dick Sisler’s three-run home run.
Left fielder Del Ennis batted .311 with 31 home runs with 126 RBIs for that team, and third baseman Willie Jones drove in 88. Center fielder Richie Ashburn hit .303.
Related Story. Tampa Bay Rays: The franchise all-time bracket. light
Game 1: the 1915 club had a 90-62 regular-season record, a .592 percentage. The 1950 team won one more game, but due to rainouts, it played two more, giving it a .591 percentage and a heartbreaking one-point defeat.
Game 2: The 1950 Phillies were swept by the New York Yankees in a four-game World Series. The 1915 team lost to the Boston Red Sox, but Alexander did manage to win the opening game. That gives the 1915 club the victory in this game as well.
Game 3: The 1915 Phillies were not known for their offense. They managed only a 97 OPS+. But neither was the 1950 Phillies, and they managed only a 93 OPS+.
Game 4: With Alexander leading the pitchers, the 1915 team amassed a 127 ERA+. Even with Roberts at the forefront in 1950, that team only recorded a 115 ERA+.
Result: 1915 in four games
No. 2 vs. 7 seed
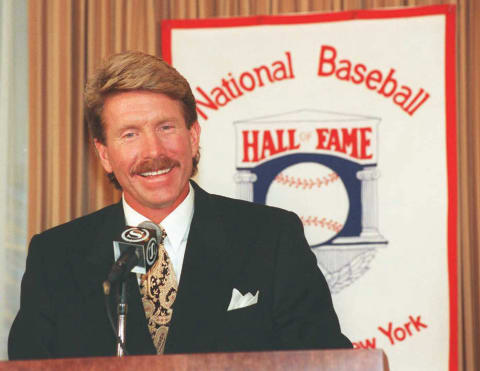
Because they were knocked out by St. Louis in the division round, the 2011 team tends to get lost in the shadow of the 2008 champions. That’s unfair. The 2011 Phillies set a franchise record with their 102 victories.
Howard hit 33 home runs and drove in 116. Outfielder Hunter Pence came over in a mid-season trade with Houston and batted .324. Rollins, Utley, and outfielder Shane Victorino all had solid seasons.
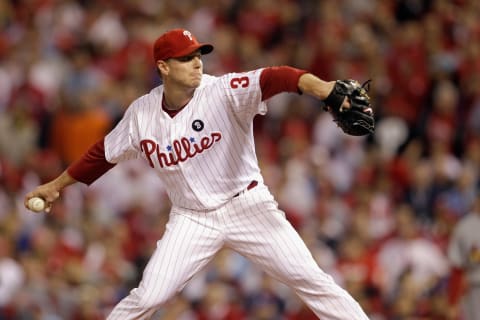
But it was the pitching staff that separated the 2011 club from the pack. Roy Halladay, in his second season with the team, won 19 of 25 decisions with a 2.35 ERA. Cliff Lee, signed as a free agent the previous winter, was 17-8 with a 2.40 ERA.
Hamels, reduced to the role of No. 3 ace, delivered a 14-9 record and 2.79 ERA. The staff’s ERA was a league-best 3.02, and they added to that 18 complete games, more than twice as many as any other team. Finally, they allowed 49 fewer runs than any other staff.
The 1977 Phillies were the second of three consecutive NL East champions. They finished five games ahead of Pittsburgh before losing to the Los Angeles Dodgers in a four-game NLCS.
This was the heyday of the slugging tandem of Mike Schmidt and Greg Luzinski. In 1977, Schmidt hit 38 homers and drove in 101 runs; Luzinski hit 39 and drove in 130. He also batted .309.
Steve Carlton was 23-10 in 36 starts with a 2.64 ERA, picking up the Cy Young Award. Larry Christenson enjoyed the best season of his career with a 19-6 record in 34 starts.
Related Story. Baltimore Orioles: The franchise all-time bracket. light
Game 1: The 1977 team finished 101-61 for a .623 regular-season percentage. But the 2011 team went it one better at 102-60, .630.
Game 2: The 1977 Phils lost three of four post-season games, a .250 percentage. The 2011 team lost to St. Louis but managed to win two games, a .400 percentage. That creates a 2-0 advantage for 2011.
Game 3: The 1977 Phils had a 108 OPS+, far superior to 2011’s 96.
Game 4: The loaded 2011 staff compiled a 127 ERA+. Even with Carlton, the best the 1977 staff could do was 109.
Game 5: The 1977 team produced 43.8 WAR. In 2011, the Phillies got to a franchise-record 54.2 WAR.
Result: 2011 in five games
Philadelphia Phillies: The All-Time Bracket
No. 3 vs. 6 seed
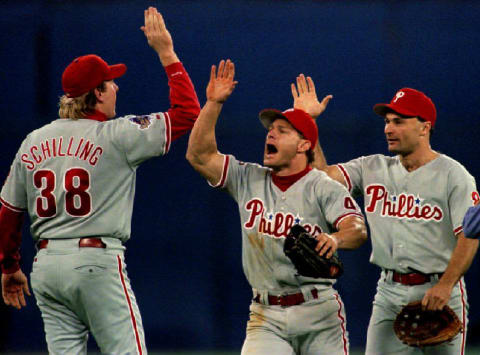
The 1980 Phillies won the franchise’s first World Series in its 98th season of play. Reflecting the era, Schmidt and Carlton were the horses.
Schmidt batted .286 with 48 home runs and 121 RBIs, winning the Most Valuable Player Award. Bake McBride hit .309 with 87 RBIs, while Rose, Luzinski, Gary Maddox, and Larry Bowa all were solid in supporting roles.
Carlton finished 24-9 in 38 starts with a 2.34 ERA, reason enough for him to pick up his third of an eventual four Cy Young Awards. He also led the league in workload at 304 innings. Dick Ruthven added a 17-10 record and 3.55 ERA.
The 1993 team lost to Toronto in six World Series games but still won 97 times during the regular season. They also eliminated Atlanta in a six-game NLCS.
Curt Schilling was the pitching star with a 16-7 record in 34 starts. Tommy Greene enjoyed the last strong season of his brief career with a 16-4 record and 3.42 ERA. Mitch Williams saved 43 games.
The lineup was a veteran-laden one led by center fielder Lenny Dykstra, first baseman John Kruk, catcher Darren Daulton and second baseman Mickey Morandini. Dykstra batted .305, Kruk hit .316 with 85 RBIs, and Daulton homered 24 times with 105 RBIs. Platoon left fielder Pete Incaviglia added 24 home runs.
Related Story. Atlanta Braves: The definitive franchise all-time bracket. light
Game 1: The 1980 Phillies had a 91-71 .562 regular season. The 1993 team was 97-65, .599.
Game 2: In 1993 the Phillies had a .500 post-season. In winning the World Series, the 1980 Phils carried a .636 post-season percentage.
Game 3: The 1980 champions only managed a 98 OPS+, well below the 1993 team’s 109. That’s a 2-1 series edge for 1993.
Game 4: The Carlton-led 1980 staff had a 110 ERA+, nine points better than the Schilling-led 1993 staff’s 101.
Game 5: In 1993 the Phillies delivered a 42.6 WAR. But that was a point and a half short of the 1980 team’s 44.2 WAR.
Game 6: The 1980 club fielded .979, two points better than the National League average. The 1993 team only fielded .977, and that was one point below the league average.
Result: 1980 in six games
Philadelphia Phillies: The All-Time Bracket
Semi-finals
Both World Series winners advance, but they face vastly different opponents.
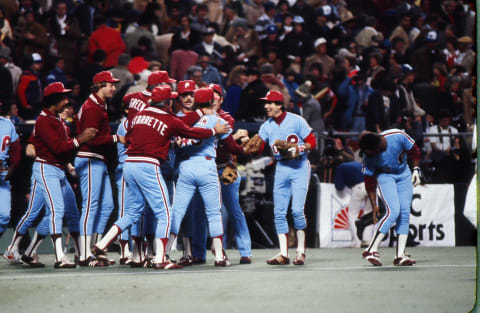
2008 vs. 1915
Game 1: The 1915 Phillies had aa 90-62 record and .592 percentage. In 2008 the champions were 92-70 in post-season, a .568 percentage. That’s a win for 1915.
Game 2: The 1980 team had a .786 post-season percentage, far superior to 1915’s .200. The series is even.
Game 3: The 1915 Phillies lacked much punch, reaching only 97 in team OPS+. The 2008 team is more highly regarded offensively, and although it only produced a 99 OPS+, that’s good enough.
Game 4: The Alexander-led 1915 staff compiled a 127 ERA+. In 2008 the Phillies had a strong staff, but its 112 ERA+ was no match for 1915. The series is tied at 2-each.
Game 5: The 1915 Phils reached 41.1 in WAR. For a championship club, that’s not very good. The 2008 team isn’t much better, but its 41.7 WAR is enough to take a 3-2 lead in the series.
Game 6: The 2008 Phillies fielded .985, one point better than the league average. The 1915 team fielded .966, but that was two points better than the league average.
Game 7: The 1915 Phillies rostered three Hall of Famers; Alexander, shortstop Dave Bancroft and pitcher Eppa Rixey. To this point the 2008 team has none, the best candidates being shortstop Jimmy Rollins, first baseman Ryan Howard, pitcher Cole Hamels, and infielder Chase Utley. None has yet been retired long enough to be on a Hall of Fame ballot.
That forces us to look at comparables, and those are not favorable to the chances of the 2008 quartet. Howard’s comparables are Mo Vaughn, Price Fielder, Nelson Cruz, and Frank Howard, excepting Cruz none of whom has drawn a whiff of Cooperstown interest. The same is true for Utley: his comparables are Ian Kinsler, Bret Boone, and Hanley Ramirez. Rollins fares better, comped by Hall of Famers Barry Larkin and Alan Trammell.
But even if he and Hamels get in, that still leaves 2008 one immortal short.
Result: 1915 in seven games
light. Related Story. New York Mets: The definitive franchise all-time bracket
2011 vs. 1980
Game 1: The 1980 champions had a 91-71 record and .562 percentage. In 2011 the Phillies played 102-60 .630 ball.
Game 2: The 1980 champions had a .636 post-season percentage, far better than 2011’s .400.
Game 3: The 1980 Phillies only managed a 98 OPS+. But the 2011 team did even worse, only reaching 96. The series stands 2-1 for 1980.
Game 4: The 2011 team had a superb 126 staff ERA+. In 1980 the Carlton-led Phillies hit 110. The series is even.
Game 5: The 2011 Phils accumulated a 54.2 WAR. In 1980 the total was 44.2.
Game 6: Seeking an upset win, the 2011 team shows off its .988 fielding percentage, five points better than the league average. Since the 1980 team only fielded .979, one point above the league average, that’s good enough.
Result: 2011 in six games
Philadelphia Phillies: The All-Time Bracket
Championship
Our all-time Phillies bracket concludes with a matchup of two teams separated by nearly a full century, neither of which had post-season success.
More from Philadelphia Phillies
- Philadelphia Phillies, ready for a stretch run, bomb St. Louis Cardinals
- Philadelphia Phillies: The 4 players on the franchise’s Mount Rushmore
- Stock Up, Stock Down: Mariners, Padres, Giants, Phillies
- Disconnect between Philadelphia and national media is embarrassing
- Stock Up, Stock Down: Two teams rising, two falling post-trade deadline
Game 1: The first game goes to 2011 for its 102-60 regular-season record and .630 percentage. Those are franchise bests; in 1915 the Phillies played 90-62 .592 ball.
Game 2: The 1915 team lost four of its five post-season games, a .200 percentage. The 2011 team lost three of five, but that’s a .400 post-season percentage and a 2-0 edge for 2011.
Game 3: Neither team was exceptional offensively. At 97, the 1915 team’s OPS+ is one point better than 2011’s 96.
Game 4: Both teams present a 127 staff ERA+. We need a tie-breaker, highest individual ERA+ among a regular starter. For 1915, that’s obviously Alexander at an other-worldly 225. The best the 2011 team can offer in response is Roy Halladay’s 163. The championship series is even at 2.
Game 5: The 1915 Phillies present a 41.1 WAR, Alexander’s 10.9 accounting for more than one-quarter of it all by himself. The 2011 team had nothing to compare with Alexander, but it did have Halladay 8.8, Lee, 8.5, and Hamels, 6.4 The result was a team 54.2 WAR and a 3-2 series advantage.
Game 6: The exceptional fielding of the 2011 team is decisive. It fielded .985, five points above the league average. In 1915 the champions fielded .966, but that was only two points better than the league average.
Next. Astros: Yordan Alvarez the next Hack Wilson. dark
Result: 2011 in six games