

Boston Red Sox: The franchise all-time bracket

Boston Red Sox fans have nine World Series winners to pick from, though famously none between 1919 and 2003. Let’s take a closer look.
The Boston Red Sox are one of the most successful teams in major league history. Since the franchise’s creation in 1901, Boston teams have a .519 regular-season percentage, 14 American League pennants and nine World Series wins.
Those statistics belie the franchise’s historic reputation for failing to win the big game, exemplified by that 85-year stretch from 1919 to 2003 when it failed to win a World Series. Prior to 1919, Red Sox teams had won five World Series – including the first won – and they have added four more since 2004.
More from Call to the Pen
- Philadelphia Phillies, ready for a stretch run, bomb St. Louis Cardinals
- Philadelphia Phillies: The 4 players on the franchise’s Mount Rushmore
- Boston Red Sox fans should be upset over Mookie Betts’ comment
- Analyzing the Boston Red Sox trade for Dave Henderson and Spike Owen
- 2023 MLB postseason likely to have a strange look without Yankees, Red Sox, Cardinals
In comprising an all-time Red Sox bracket, there is, then a lot to choose from. It’s appropriate to begin with those four World Champions of the past two decades. While it would be overly generous to allot four bracket spots to that period, three is not out of the question. The 2007 team, which won the fewest regular-season games, is the logical omission.
From the early period, the 1912 team is the strongest representative. Not only did that team win the World Series, but it also won 105 games, a franchise record until exceeded by the 2018 Sox.
That leaves four spots available for the great Red Sox teams of the vast middle of the 20th Century. Those choices are pretty obvious: the pennant winners of 1946, 1967, 1975 and 1986. Not only were they all quality teams, but there is a synoptic spread to their chronology, occurring as they do every decade or two.
Related Story. Miami Marlins: The franchise all-time bracket. light
The format is identical to previous bracket challenges. Each matchup in the tournament is decided based on seven criteria. You can think of each as a ‘game,’ the winner of four games advancing. The seven criteria are:
- Game 1: Regular season winning percentage.
- Game 2: Post-season winning percentage
- Game 3: Team OPS+
- Game 4: Team ERA
- Game 5 (if necessary): Team WAR
- Game 6 (if necessary: Fielding percentage above the league average for the season in question.
- Game 7 (if necessary): The standard for Game 7 is Hall of Famers or likely future Hall of Famers.
Boston Red Sox: The All-Time Bracket
Game 1
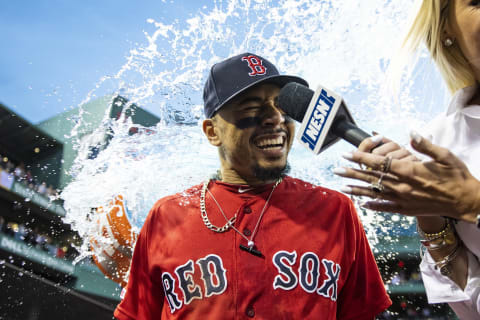
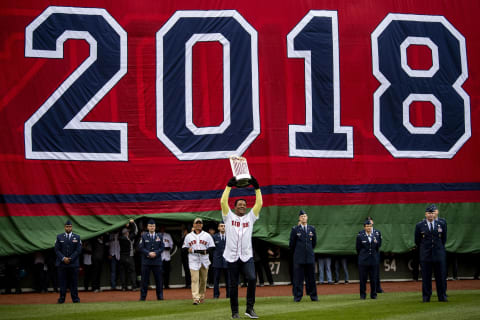
The 2018 team’s 108 victories make it the winningest in franchise history. It’s no surprise, therefore, that the roster presents few if any weaknesses.
Begin with outfielder Mookie Betts. He hit .346, good enough to take the batting title, with 32 homers and 80 RBIs. That resume got him the Most Valuable Player Award.
Add DH J.D. Martinez, who delivered 43 homers, 130 RBIs and a .330 average. Andrew Benintendi and Xander Bogaerts would have been stars on any other team.
The pitching staff features Chris Sale, 12-4, and David Price, 16-7. Rick Porcello added 17 wins and a 4.28 ERA. Craig Kimbrel saved 42 games.
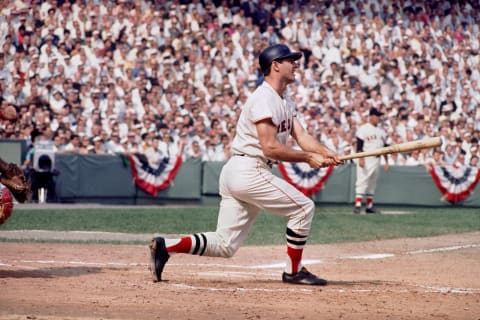
The 1967 ’Impossible Dream’ Red Sox came from ninth place one season earlier to win a pulsating four-team pennant race that wasn’t decided until the season’s final game. Carl Yastrzemski enjoyed the best season of his Hall of Fame career, winning the Triple Crown with a .326 batting average, 44 homers, and 121 RBIs. First baseman George Scott hit .303 with 82 RBIs, and Tony Conigliaro was hitting .287 with 20 homers and 67 RBIs when he was beaned in mid-August ending his season prematurely.
An otherwise lackluster mound staff was led by Cy Young Award winner Jim Lonborg, who was 22-9 in 39 starts with a 3.16 ERA.
Related Story. Tampa Bay Rays: The franchise all-time bracket. light
Game 1: The 2018’s .691 regular-season percentage is unassailable in Boston Red Sox history. For the record, the 1967 team played 92-70 .568 ball.
Game 2: the 1967 team lost a seven-game World Series to the St. Louis Cardinals. The 2018 team beat the Yankees in a four-game division series, eliminated Houston in five ALCS games, and beat Los Angeles in a five-game World Series. That’s a persuasive .786 post-season percentage.
Game 3: In 2018 the Red Sox had a 112 OPS+, nine points better than 1967’s 103.
Game 4: Lonborg carried the 1967 club to a 105 ERA+. But the 2018 staff put together a 118 ERA+, wrapping up the first-round series.
Result: 2018 in four games
Boston Red Sox: The All-Time Bracket
No. 4 vs. 5 seed
The 2004 and 2013 World Series winners are an evenly matched set of representatives of their era. The 2004 team famously came back from a 3-0 ALCS deficit against the Yankees to reach the World Series, where they swept St. Louis to end the franchise’s curse.
Outfielder Manny Ramirez and DH David Ortiz provided a double jolt of power, combining for 84 homers and 269 RBIs. Ramirez batted .304, three points higher than Ortiz. Johnny Damon hit .304 with 20 homers and 94 RBIs.
The pitching staff was led by the veteran duo of Pedro Martinez and Curt Schilling. Martinez was 16-9 with a 3.90 ERA while Schilling produced a 21-6 season with a 3.26 ERA.
The 2013 team beat Tampa Bay by five and one-half games to take the AL East, polished off the Rays in four division series games, and took the American League pennant over Detroit in six. They, too, beat the Cardinals in the World Series, this time needing six games.
Second baseman Dustin Pedroia hit .301 in support of Ortiz, who added 30 home runs and 103 RBIs to his .309 average. First baseman Mike Napoli drove in 92 runs with 23 home runs.
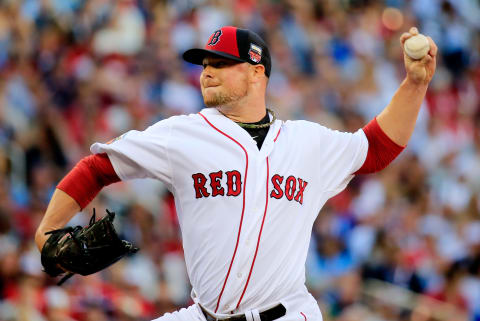
Jon Lester led the pitching staff with a 15-8 record in 33 starts. Clay Bucholtz missed the equivalent of three months due to injuries, but still managed 12-1 record and 1.74 ERA in 16 starts.
Related Story. Baltimore Orioles: The franchise all-time bracket. light
Game 1: the 2004 Sox won 98 games, one more than the 2013 team. That gave them a .605 regular-season percentage, six points better.
Game 2: The 2004 team had a .786 post-season record. In 2013 the Sox played .733 post-season ball. The series stands at 2-0 in favor of 2004.
Game 3: The 2013 Sox produced a 116 OPS+, six points better than 2004’s 110.
Game 4: In 2004 Martinez and Schilling led the Boston staff to a 116 ERA+. Lester led the 2013 staff to a 109 ERA+ that is good but not good enough to avoid a 3-1 series deficit.
Game 5: The 2013 Red Sox accumulated 54.4 WAR. That’s just enough to get past 2004’s 53.6 and send the series to a sixth game.
Game 6: In 2004 the Red Sox fielded .981, one point worse than the league average. The 2013 team field .987, two points better than the league average.
Game 7: The 2004 club has to date produced just one Hall of Famer, Martinez. But Schilling and Ortiz are strong candidates for future enshrinement, Ortiz also played on the 2013 team, whose best Hall of Fame options besides him are Lester and Xander Bogaerts, both still active. But the 2013 team would probably need all three just to break even with 2004, and the comparables – Dwight Gooden, Jimmy Key, Dave McNally – suggest that Lester for one is likely to come up short.
Result: 2004 in seven games
Boston Red Sox: The All-Time Bracket
No. 2 vs. 7 seed
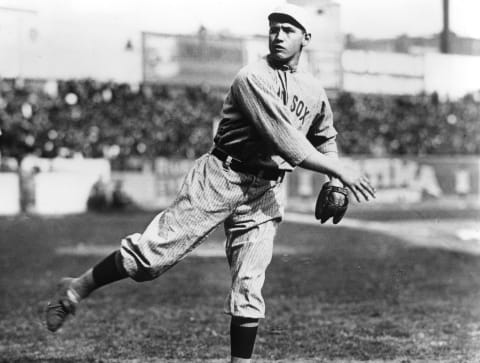
The 1912 Red Sox may be one of the best teams you’ve never heard of. Their on-field leaders were center fielder Tris Speaker and pitcher Smoky Joe Wood, both of whom had exceptional seasons.
Speaker batted .383 with 90 RBIs and stole 52 bases, all that adding up to a 1.021 OPS. Fellow outfielder Duffy Lewis added a.384 average and 109 RBIs.
Wood made 38 starts and five relief appearances, compiling a 34-5 record and 1.91 ERA. Sixteen of his victories came in succession between July 4 and mid-September, when Ty Cobb’s Detroit Tigers finally got him. He also struck out 258 opponents, that in a season when the average team only struck out four times per game.
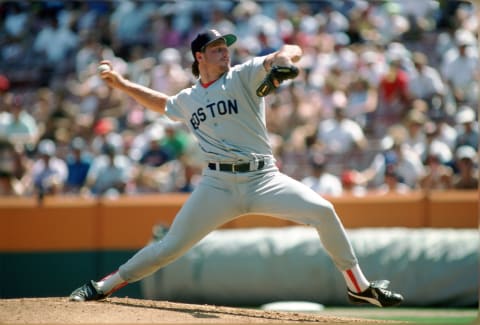
The 1986 Red Sox had the modern version of Joe Wood in 23-year-old Roger Clemens. He was 24-4 with a 2.48 ERA, striking out 238. Those numbers were good enough to take both the CY Young and MVP awards.
Wade Boggs led the offense with a league-leading .357 average. Left fielder Jim Rice delivered 20 home runs and 110 RBIs, and first baseman Bill Buckner drove in 102 runs.
Related Story. Atlanta Braves: The definitive franchise all-time bracket. light
Game 1: The 1912 Red Sox were 105-47, a .691 percentage. That’s 14 and one-half games better than 1986’s 95-66 .590.
Game 2: In post-season play, the 1912 team beat the New York Giants in eight games, one of them ending in a tie. The 1986 team lost a seven-game series to the Mets. That gives 1912 a 2-0 series lead.
Game 3: Both teams produced a 107 OPS+, necessitating a tie-breaker, and that tie-breaker involves two certified immortals. In 1912, Speaker’s OPS+ was 189. In 1986, Boggs produced a 157 OPS+, excellent but not up to Speaker’s level.
Game 4: Seeking a sweep, the 1912 team leads with Wood, who drove that staff to a 123 ERA+. Despite Clemens, the 1986 club only got to 107.
Result: 1912 in four games
Boston Red Sox: The All-Time Bracket
No. 3 vs. 6 seed
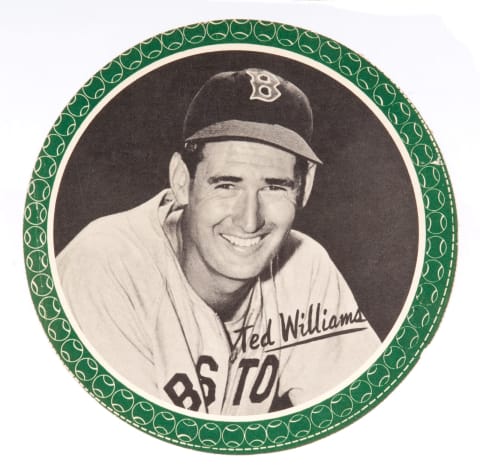
The 1946 Red Sox were led by Ted Williams, back from the war and knocking out a .342 average with 38 homers and 123 RBIs. Center fielder Dom DiMaggio hit. 316, and shortstop Johnny Pesky batted .335. First baseman Rudy York and second baseman Bobby Doerr added 119 and 116 RBIs respectively to Williams’ total.
Dave Ferriss surprised experts by winning 25 of his 31 decisions in by far the best season of his career. Tex Hughson added a 20-11 record and 2.75 ERA to give the Sox a powerful one-two mound presence.
Boston sailed to the 1946 pennant by 12 games over the defending champion Detroit Tigers before losing the World Series in seven games to St. Louis.
In 1975 the Red Sox beat Baltimore by four and one-half games for the AL East title, then dethroned the three-time World Champion Oakland Athletics in an ALCS sweep. They lost that dramatic seven-game World Series to Cincinnati.
Fred Lynn arrived to bat .33 with 21 home runs and 105 RBIs, sweeping both the Rookie Of The Year and MVP vote. Fellow rookie Jim Rice added a .309 average, 22 homers and 102 RBIs, finishing second in Rookie of the Year balloting and third in the MVP vote.
Yastrzemski, having made the switch to first base in deference to Rice’s arrival, drove in 60 runs.
The pitching staff lacked a star but it had plenty of personalities. Luis Tiant was 18-14 and Bill Lee, known as the Spaceman for his sometimes far-out ways, was 17-9.
Related Story. New York Mets: The definitive franchise all-time bracket. light
Game 1: The 1975 club had a 95-65 record and .594 percentage. In 146 the Sox were 104-50, .675.
Game 2: Both teams lost a seven-game World Series, but the 1975 club had the benefit of playing a three-game ALCS, which it swept. That lifted its post-season percentage to .600.
Game 3: The 1975 Sox produced a 107 OPS+, one point higher than the Williams-led 1946 team. That gives a 2-1 series lead to 1975.
Game 4: In 1946 the Red Sox staff rolled up a 108 ERA+, four points better than the 1975 team’s 104.
Game 5: The 1946 Sox accumulated 43.2 WAR, Williams accounting for 10.6 of that. The 1975 team got 7.4 WAR from Lynn but couldn’t stack up with 1945, finishing its season at 41.2 WAR. That creates a 3-2 lead for 1946.
Game 6: The 1946 team fielded .977, four points better than the league average. The 1975 Red Sox also had a .977 percentage, but it was only two points better than the 1977 AL average.
Result: 1946 in six games
Boston Red Sox: The All-Time Bracket
Semi-finals
The semis are set up to determine the best of the new plus the best of the old, and to pit the winners against each other in a cross-era championship.
2018 vs. 2004
Game 1: The 2018 team had the better regular season, with 108 wins, 10 more than in 2004. In percentage terms, the difference was 62 points.
Game 2: Both teams had .786 post-season records. We need to consult the tie-breaker, post-season run differential. In 2004 the Red Sox out-scored their post-season opponents by 21 runs. But in 2018, the margin was 27 runs, giving 2018 a 2-0 series advantage.
Game 3: The 2018 team had a 112 OPS+, two points better than 2004’s 110.
Game 4: The 2018 staff produced a 118 ERA+. In 2004 the Schilling-Martinez staff only got to 116. The series is a sweep.
Result: 2018 in four games
Related Story. San Diego Padres: The franchise all-time bracket. light
1912 vs. 1946
Game 1: the 1912 Sox had a 105-47 record, .691. That’s slightly better than 1946’s 104-50, .675.
Game 2: The 1912 team won a seven-game (actually eight-game) World Series, while the 1946 club lost in seven games.
Game 3: In 1912 Speaker led Boston to a 107 OPS+. The 1946 team stopped at 106, one point short.
Game 4: The 1912 Sox produced a 123 ERA+ largely thanks to Wood. In 1946 the Red Sox had a credible but insufficient 108 ERA+.
Result: 1912 in four games
Boston Red Sox: The All-Time Bracket
Championship
Both the 2018 and 1912 teams enter this final match having not yet lost so much as a game, much less a series. That’s about to change.
More from Boston Red Sox
- Boston Red Sox fans should be upset over Mookie Betts’ comment
- Analyzing the Boston Red Sox trade for Dave Henderson and Spike Owen
- Stock Up, Stock Down: Braves, Yankees, Cubs, Red Sox
- Boston Red Sox: The 4 players who are on the franchise’s Mount Rushmore
- Stock Up, Stock Down: Two teams rising, two falling post-trade deadline
Game 1: In 2018 the Red Sox were 108-54, .667. The 1912 Red Sox only won 105 games, but they only played 152. Their .691 percentage is better.
Game 2: The 1912 team’s .571 post-season percentage doesn’t match up with 2018’s .786.
Game 3: In 1912 Speaker led the Sox to a 107 OPS+, but that’s five points short of 2018’s 113.
Game 4: The 1912 Sox had a 123 ERA+, five points better than 2018’s 118. This series is tied at 2-each.
More. Red Sox: Pearce going out in a blaze of glory. light
Game 5: The 2018 team amassed a 56.6 WAR. That’s a franchise record and just barely better than 1912’s 55.3.
Game 6: The 2018 team fielded .987, two points better than the league average. The 1912 team fielded .957, and that was five points better than the league average. The series proceeds to a seventh game, looking at immortals.
Game 7: We begin with the 1912 team whose immortality is certifiable. It includes Speaker and fellow outfielder Harry Hooper. It does not include Wood, whose career was cut short by an arm injury.
Red Sox 2021 manager: Alex Cora. dark. Next
Obviously the Hall of Fame credentials of the 2018 team is more subject to debate. At this early stage, however, there are several candidates, notably Betts and pitchers David Price and Craig Kimbrel. The chances of several others, Bogaerts, Rafael Devers, Chris Sale, and Dustin Pedroia are harder to quantify but can’t be ruled out.
While it’s no certainty to project that 2018 Red Sox as eventually producing three Hall of Famers, the odds at this point are good enough to at least give them the benefit of the doubt.
Result: 2018 in seven games