MLB Dream Bracket: Who wins between the Reds and the Dodgers?

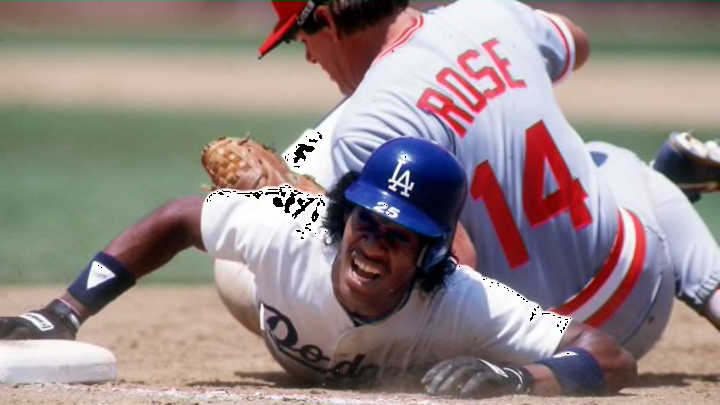
LOS ANGELES, CA - 1985: Pete Rose #14 of the Cincinnati Reds pins down Mariano Duncan #25 of the Los Angeles Dodgers as he dives back to first base during a game at Dodger Stadium, Los Angeles, California. (Photo by Jayne Kamin-Oncea/Getty Images)
2 of 3
Next
(Photo by John McCoy/Getty Images)
(Photo by John McCoy/Getty Images) /

The MLB Dream Bracket has reached the semi-finals in the NL and the Cincinnati Reds are set to face the Los Angeles Dodgers. Who wins?

The MLB Dream Bracket has given baseball fans the respite they need during the tough times brought upon by the novel coronavirus. As we mentioned yesterday, it features 32 teams split into two, half on the American League side (including the Negro League All-Stars) and the other half on the National League (including the 25 and Under All-Stars).

Each side has now been widdled down to two teams. Yesterday, we previewed the AL matchup between the New York Yankees and the Boston Red Sox. Today, we’ll take a deep-dive into the NL matchup between the Cincinnati Reds and the Los Angeles Dodgers.

More from Call to the Pen

Like the Yanks and the Sox, The Reds and the Dodgers are also two of the most storied in MLB history. In fact, the Reds came into existence way back in 1882 as the Cincinnati Red Stockings. In the 138 seasons since, Cincy has a .505 W-L%, 15 playoff appearances, 10 pennants, and 5 World Series titles.

The Dodgers arrived two years after the Reds, in 1884 as the Brooklyn Atlantics and in the 136 seasons since have put together a .528 W-L%. What’s more, the Dodgers have appeared in 33 postseasons, have 24 pennants, and 6 World Series championships to their name

In the following slides, we have taken the liberty of taking the players of each team’s rosters and compiling their stats. In doing this, we’re going to make our determination, or rather, prediction for who will win the National League championship game and face off against the AL team for the title of the greatest team of all time.

To begin, let’s break down each team’s offense.

Pete Rose #14, of the Cincinnati Reds (Photo by: 1974 SPX/Diamond Images via Getty Images)
Pete Rose #14, of the Cincinnati Reds (Photo by: 1974 SPX/Diamond Images via Getty Images) /

MLB Dream Bracket: Yankees vs Red Sox

The Offensive Advantage

As we mentioned in the AL piece, for the Dream Bracket, MLB has designated 15 offensive players to each team, one for each position, including DH, a six bench players. Here are the rosters for each team:

Cincinnati Reds: Johnny Bench, Joey Votto, Joe Morgan, Pete Rose, Barry Larkin, George Foster, Eric Davis, Frank Robinson, Ted Kluszewski, Tony Perez, Dave Concepcion, Vada Pinson, Adam Dunn, Jay Bruce, Ernie Lombardi

Los Angeles Dodgers: Roy Campanella, Gil Hodges, Jackie Robinson, Ron Cey, Pee Wee Reese, Gary Sheffield, Duke Snider, Cody Bellinger, Steve Garvey, Maury Wills, Shawn Green, Matt Kemp, Andre Ethier, Pedro Guerrero, Mike Piazza

Offensively, both the Reds and the Dodgers are rather close when analyzing both traditional and advanced stats. In the end, however, one team does exceed the other in every category but one: WAR.

Before we jump to that though, let’s break down what we know.

First, in looking at batting average, Los Angeles edges Cincinnati by .006 points. The Dodgers sport a lifetime .286 AVG versus the Reds’ .280 AVG. In on-base percentage (OBP), it’s similar. LA has a .363 OBP and the Reds have a .358 OBP, a difference of just .005 points.

Similarly, in the more advanced stats, the Dodgers have the advantage. In slugging, for example, Los Angeles has a .476 SLG and Cincy has a .464 SLG. And again, we see the same story in wOBA and wRC+, though the margins are much slimmer.

Related Story. Los Angeles Dodgers: The franchise all-time bracket. light

  • Dodgers: .368 wOBA | 125 wRC+
  • Reds: .363 wOBA | 123 wRC+

As for wins above replacement (WAR), or the number of wins each offense brings to the table, the Reds have the advantage over the Dodgers, 650.3 to 823.9. That’s a difference of 173.6 wins.

Unfortunately, I can’t let a single stat determine who gets the advantage in this regard. Therefore, my prediction is that the Los Angeles Dodgers have the offensive advantage.
Clayton Kershaw #22 of the Los Angeles Dodgers (Photo by Denis Poroy/Getty Images)
Clayton Kershaw #22 of the Los Angeles Dodgers (Photo by Denis Poroy/Getty Images) /

MLB Dream Bracket: Yankees vs Red Sox

Who Has the Better Pitching Staff?

To round up each team’s 26-man roster, each team also features a pitching staff of 11 starters and relievers. With that, here is the pitching staff for each team:

More from Cincinnati Reds

Cincinnati Reds: Tom Seaver, Jim Maloney, Mario Soto, Jose Rijo, Aroldis Chapman, Randy Myers, Norm Charlton, Rob Dibble, John Franco, Don Gullett, and Johnny Cueto.

Los Angeles Dodgers: Sandy Koufax, Clayton Kershaw, Don Drysdale, Don Sutton, Kenley Jansen, Eric Gagne, Mike Marshall, Phil Regan, Fernando Valenzuela, Don Newcombe, and Orel Hershiser.

In pitching, you have a similar story, only it’s the Reds that lead in every category but two: W-L% and WAR. This comes as a surprise when you consider that the Dodgers feature a staff of guys like Kershaw, Koufax, Drysdale, etc. It seems that every arm out of Los Angeles is beyond elite.

That being said, the numbers don’t lie and this is how they fall.

When taking wins out of the equation, the Reds edge the Dodgers in both ERA and FIP. In fact, Cincinnati features a lifetime ERA of 3.11 and a FIP of 3.19, while the Dodgers have a 3.16 ERA and a 3.24 FIP.

More. Cincinnati Reds: Bauer has top notch troll game. light

Considering that the difference in there is quite small, we have to allow win-stats to play a major role in the process of deciding who the best NL team is. In doing that, the Dodgers have the advantage as they feature a .576 W-L% versus the Reds’ .569.

What’s more, LA also has a 444.5 WAR versus the Reds’ 309.8, giving the Dodgers a distinct advantage when considering wins.

Now, while we ultimately made our decision in the AL by totaling WAR stats on both sides of the ball, we just can’ let that slide here. If we were to allow it, then the Reds would win because according to WAR, they’re worth about 39 more wins than the Dodgers.

dark. Next. The MLB all-time bracket challenge: Part 1

However, given that the Dodgers are better than the Reds in every offensive category except WAR and they take an advantage in the win-stats for pitching, we have to make the ultimate determination that Los Angeles will ultimately win and face off against the Yankees for the MLB Dream Bracket finals.

Next