Here’s a prediction: 2020 MLB season will be unpredictable

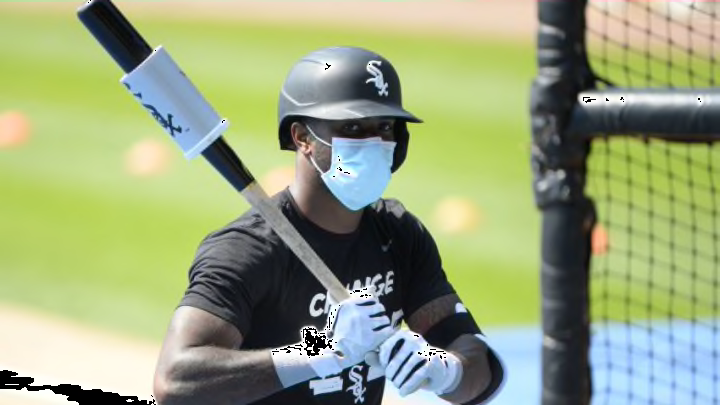
CHICAGO - JULY 06: Tim Anderson #7 of the Chicago White Sox looks on while wearing a face mask during summer workouts as part of Major League Baseball Spring Training 2.0 on July 6, 2020 at Guaranteed Rate Field in Chicago, Illinois. (Photo by Ron Vesely/Getty Images)
3 of 6
Next
Cardinals pitcher Jack Flaherty had wild performance swings during 2019. (Photo by John Capella/Sports Imagery/Getty Images)
Cardinals pitcher Jack Flaherty had wild performance swings during 2019. (Photo by John Capella/Sports Imagery/Getty Images) /

The short 2020 MLB season virtually guarantees wild performance swings that would even out over the course of a full regular season

Of all the silly expenditures of energy in anticipation of the start of the 2020 MLB season, the silliest has to involve those attempting to predict the outcome of the races.

In a 60-game, regionally-based season, there’s simply no statistical way to do it.

Consider the evidence from 2019. The consensus is that to be a serious post-season contender this year, a team will have to win at least 35 games. For the record, that’s a.583 winning percentage, strong by historical standards but valid for the sake of argument in 2020.

By contrast, the consensus is that any team winning fewer than half its games in 2020 can be summarily dismissed from contention.

With that as a background, ponder this question: During the 2019 season, how many teams had 60-game stretches in which they won at least 35 games, AND also had 60-game stretches when they played .500 ball or worse?

For the record, the correct answer is 11; that’s more than one-third of all the teams who – depending on which part of the 2019 season you are looking at – both played ball that would be dominant or disqualified if they did the same thing in 2020.

Here’s a companion question: With 43-17 records, three teams shared the 2019 record for best performance over a 60-game stretch of 2019. Two of those teams were the Los Angeles Dodgers and Houston Astros. Care to guess who the third 43-17 team was? Hint: They did not make the playoffs. The answer will follow below.

(Photo by Norm Hall/Getty Images)
(Photo by Norm Hall/Getty Images) /

For MLB prognosticators, the problem lies in the inherent up-and-down nature of a long season by comparison with something as short as a 60-game sprint. Of the 11 MLB teams that won at least 35 games during a given 60-game stretch in 2019, six – the Boston Red Sox, Cleveland Indians, Chicago Cubs, San Francisco Giants, Colorado Rockies, and New York Mets – failed to reach post-season play.

The other five teams who won at least 35 games during a 60-game stretch but also had a .500 or worse 60-game stretch were the Tampa Bay Rays, the Oakland Athletics, the St. Louis Cardinals, the Washington Nationals and the Milwaukee Brewers.

The Giants provided perhaps the most striking illustration of this “who knows what you’ll get in a sprint” phenomenon. During their first 60 games, they went 25-35, a .417 percentage that effectively ruined their season. Yet only a little more than a month later – during a 60-game stretch between games 65 and 124 – the Giants had a 37-23 record, a .617 percentage. Same team, same season, two vastly different results.

The Mets provided an even more stark example. Between games 24 and 83 – basically mid-April to mid-June, they stumbled along at a 24-36 rate, a .400 percentage that left them far behind the NL East leaders.

Yet between games 103 and 162 – fundamentally the final two months of the season – the Mets played 39-21 ball, a .650 winning percentage.

The vagaries of a 60-game season are likely to dramatically impact the performance of players as well, as a look at the 2019 breakdowns of some of the game’s best will illustrate. But first the answer to that question.

Between games 60 and 119 – essentially the months of June and July – the Cleveland Indians went on a 43-17 tear, matching Houston and Los Angeles for the best 60-game run in MLB in 2019. Yet the Indians failed to play a post-season game because they were 50-52 the rest of the year.

Los Angeles Angels Anthony Rendon. (Photo by Jayne Kamin-Oncea/Getty Images)
Los Angeles Angels Anthony Rendon. (Photo by Jayne Kamin-Oncea/Getty Images) /

The Rendon Effect

To gauge how much a MLB player’s performance can vary almost haphazardly during a season, it is only necessary to look at the actual performances of some of the game’s brightest stars. At periods during the season, they appear unbeatable. At different periods, you may wonder what they’re being paid for. And depending on which 60-game season they deliver in 2020, the fortunes of their teams may rise or fall equally dramatically.

The performance line of Anthony Rendon, now with the Los Angeles Angels, but, at the time, leading Washington to a World Series victory, illustrates the almost random nature of short-stretch production.

Rendon’s season-long numbers were impressive. He batted .319, had a 1.010 OPS, hit a league-leading 44 home runs, drove in a league-leading 126 runs, and finished third in the MVP voting.

But Rendon’s season was far from uniform. Considering only the 60-game portion from April 14 through July 5, he was at best just a decently productive player. Rendon batted .279 with 44 RBIs and a .905 OPS. Those numbers are perfectly acceptable, but they would not elevate him into the MVP discussion.

But then consider Rendon’s performance during the 60-game stretch from July 12 through Sept. 16. During that period, he batted .370 with 57 RBIs and a 1.011 OPS.

From his worst 60-game stretch to his best, the variance in Rendon’s batting average amounted to 91 points. His OPS moved by 206 points.

If you’re the Angels, all you are reasonably sure of regarding Rendon in 2020 is that he’s going to land somewhere between .279 and .370 in batting average, and between .905 and 1.011 in OPS. That’s a large discrepancy, and it’s due to the unpredictability of the shortened season.
Angels outfielder Mike Trout. (Photo by Sean M. Haffey/Getty Images)
Angels outfielder Mike Trout. (Photo by Sean M. Haffey/Getty Images) /

The consensus judgment is that Mike Trout is MLB’s best player. Over the course of a 162-game season, it’s hard to argue with the numbers. Last year Trout batted .291 with a league-leading .438 on base average, a league-leading .645 slugging average, and (obviously) a league-leading 1.083 OPS.

Heady stuff indeed.

Would your perception of Trout change much if in 2020 his on base average tumbled by 50 points with lesser declines in batting and slugging averages? That actually happened over a 60-game stretch toward the end of Trout’s 2019 season.

Since Trout missed the season’s final three weeks, the period we’re talking about occurred between mid-June and his final game Sept. 7. It’s not that Trout was bad over that stretch; he just wasn’t as Trout-like. He batted .274 with a .390 on base average, 48 points below his season-long on base average.

Contrast that Mike Trout with the one who dominated baseball over the season’s first two months. Between March 29 and June 8 – 60 games for Trout – he had a .456 on base average. Between the end of May and early August, he batted .317 AND slugged .756. That’s a 137-point difference in slugging average just between the May 30 to August 10 and June 20 to Sept. 4 stretches.

Again, the same player, and in this case 6-game periods with significant overlap…but sharply differing performance levels.

Yankee slugger Aaron Judge. (Photo by Mark Brown/Getty Images)
Yankee slugger Aaron Judge. (Photo by Mark Brown/Getty Images) /

Trout’s performance line also suggests the vast impact that injuries can have on a player’s value, especially over a short season. Two other cases provide stark illustrations of this unknown.

Chicago White Sox shortstop Tim Anderson won the American League batting title with a .335 average. But Anderson missed virtually the entire month of July with injuries. Looking purely at the 60 games the Sox played between May 20 and July 31, this is what they got from Anderson: Only 117 at bats, a .274 average and a .280 on base average.

Contrast that with what the White Sox got from Anderson toward season’s end. Beginning with his late July return and continuing into the season’s final week – a 53-game window —  Anderson batted .365 in 219 official at bats. During that window, his on base average peaked at .382

The Yankees had a similar experience with their slugger, Aaron Judge. He missed about two months between mid-April and mid-June with injuries. Superimpose the Aaron Judge of that 60-game window onto the short 2020 season and he is essentially worthless.

Once Judge returned in 2019, he gradually found his batting stroke. During the 60-game stretch between late June and late August, Judge batted .292 with a .393 on base average and .546 slugging average. Over the course of the full season, what the Yankees got from Judge was fundamentally what they might have expected: 447 plate appearances, a .27 2 average and .921 OPS.

The full course of a 162-game MLB season tends to contextualize injuries such as those sustained by Judge and Anderson.  But when injuries strike during a 60-game season, they can overwhelm context.

Chicago’s Yu Darvish. (Photo by Masterpress/Getty Images)
Chicago’s Yu Darvish. (Photo by Masterpress/Getty Images) /

Good pitchers and bad ones go through 60-game stretches where their performance can vary greatly. In 2019, there was no better illustration of this than St. Louis Cardinals starter Jack Flaherty.

In 2019, Flaherty had an 11-8 record with a 2.75 ERA in 33 starts. But Flaherty’s season was marked by dramatic performance swings.

Over the season’s first half, Flaherty was average at best. Between May 3 and July 7 – a 60-game stretch on the Cardinals calendar – he made a dozen starts, going 1-5 with a 5.07 ERA.

More from Call to the Pen

Then Flaherty got hot, and in his case, it was broiling hot. Across a 60-game span between July 3 and Sept. 8, the same Flaherty went 6-2 with a 0.81 ERA, in the process rallying the Cardinals to the divisional title.

Same pitcher, virtually back-to-back 60-game stretches, two markedly different performance patterns.

Yu Darvish knows the feeling. During a 60-game stretch on the Cubs’ schedule between April 4 and June 10 Darvish basically stunk. He made 13 starts and went 2-3 with a 5.09 ERA. You could have forgiven the Cubs for wondering why they expended all that cash on a pitcher with a 5.00 ERA.

The Darvish pivoted in mid-season. During another 60-game stretch between July 3 and Sept. 12, he was one of the game’s best pitchers. Although  just 4-2, he had a 2.74 ERA , allowing 18 fewer earned runs while working two more innings than he had during that earlier disastrous stretch.

The in-season turnaround made by Cleveland’s Shane Bieber had some of the same qualities. During the 60 Indians games between April 14 and June 20, Bieber managed a 5-3 record but piled up a 4.56 ERA. Then he turned unhittable. During a second 60-game stretch between July 5 and Sept. 9, the same pitcher compiled a 7-4 record thanks to a 2.59 ERA. That’s a shave of nearly two full points off his ERA in two periods separated by about two weeks.

dark. Next. Oddball season leads to opportunity

Here’s the bottom line: It is impossible to predict individual performance – and thus team performance – over a 60-game schedule. There are simply too many human-related variables affecting that performance. That means once MLB play actually begins, virtually anything could happen.

Next