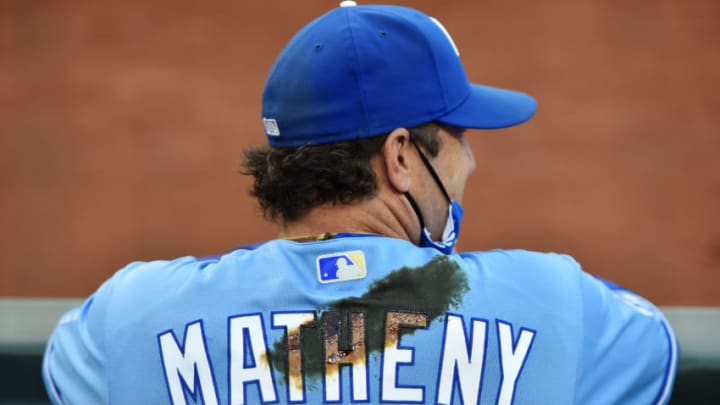
Mike Matheny had the most active hand of any MLB manager this past season
This was not a good season for the Kansas City Royals. They finished 26-34 and outside the expanded MLB playoffs. But you can’t blame the Royals’ manager for lack of effort.
Based on data supplied by Baseball Reference, Royals manager Mike Matheny was the most active field manager in the game in 2020. That judgment is based on the frequency of every 2020 manager’s use of five tactical in-game decisions
On a per-game basis, those five are the average numbers of:
- Steal attempts.
- Sacrifice bunt attempts.
- Intentional walks.
- Pinch hitters.
- Pitchers used.
Matheny was an easy No. 1, averaging 8.76 such moves per game. That was more than a move per game ahead of the runner-up, Kevin Cash of the American League champion Tampa Bay Rays. Cash averaged 7.45 moves per game in leading the Rays to a 40-win regular season.
Matheny’s most obvious characteristic was his frenetic-by-modern-standards use of the stolen base. His Royals attempted 65 stolen bases in the hope of jump-starting a generally spotty offense. That’s an average of about 1.08 steal attempts per game. For the record, they were successful about 70 percent of the time.
Only three other managers – Jayce Tingler in San Diego, Scott Servais in Seattle, and Don Mattingly in Miami – averaged more than one stolen base per game.
Matheny also showed a strong willingness to go to his bullpen. He used 4.9 pitchers per game, matching the second highest usage rate in the majors in 2020. The only manager willing to make more bullpen moves was the game’s most successful one, Dodgers manager Dave Roberts.
In taking Los Angeles to a 43-17 regular season record, Roberts averaged 5.2 pitchers per game.
There did not, however, appear to be much of a correlation at all between the number of moves a manager made and his team’s playoff status.
Among managers of the six division champions, only Cash and Roberts ranked among the upper half in terms of activity. Ten of the 16 playoff managers ranked among the least active half, including the six least active of all.
Where did your favorite manager rank in 2020 as a hands-on leader? The table below contains the full data. Where a team changed managers during the season, data shown is for the manager who worked the most games. All figures represent attempts on a per-game basis,
Team Mgr SB Sac IBB PH P Total
KCR Matheny 1.08 0.57 0.47 0.85 4.90 7.87
TBR Cash 0.90 0.00 0.70 1.15 4.70 7.45
SFG Kapler 0.45 0.07 0.03 1.25 4.90 6.70
Bos Roenicke 0.63 0.07 0.07 1.96 3.90 6.63
SDP Tingler 1.05 0.20 0.03 0.73 4.60 6.61
LAD Roberts 0.55 0.05 0.07 0.72 5.20 6.59
Mia Mattingly 1.03 0.10 0.23 0.62 4.60 6.58
Tor Montoyo 0.62 0.13 0.12 0.68 4.80 6.35
Hou Baker 0.55 0.10 0.12 1.53 4.00 6.30
Phi Girardi 0.72 0.27 0.30 0.80 4.20 6.29
Det Gardenhire 0.36 0.20 0.20 0.56 4.80 6.12
Col Black 0.82 0.12 0.08 0.87 4.20 6.09
Was Martinez 0.68 0.08 0.37 0.52 4.40 6.05
Bal Hyde 0.52 0.25 0.03 0.73 4.50 6.03
Tex Woodward 0.98 0.03 0.05 0.52 4.40 5.98
Atl Snitker 0.43 0.02 0.22 0.48 4.80 5.95
Sea Servais 1.10 0.05 0.12 0.47 4.20 5.94
LAA Maddon 0.48 0.10 0.13 0.37 4.80 5.88
Mil Counsell 0.43 0.00 0.02 1.13 4.20 5.78
CWS Renteria 0.47 0.02 0.10 0.38 4.70 5.67
Chc Ross 0.55 0.02 0.12 0.87 4.10 5.66
Ari Lovullo 0.48 0.02 0.33 0.47 4.30 5.60
NYM Rojas 0.50 0.02 0.12 0.63 4.30 5.57
Pit Shelton 0.45 0.12 0.05 0.43 4.50 5.55
Cle Francona 0.57 0.12 0.13 0.65 4.00 5.47
Stl Shildt 0.45 0.07 0.14 0.55 4.10 5.31
Min Baldelli 0.35 0.04 0.00 0.50 4.40 5.29
NYY Boone 0.55 0.02 0.08 0.65 3.90 5.20
Oak Melvin 0.48 0.04 0.10 0.58 4.00 5.20
Cin Bell 0.63 0.00 0.10 0.30 3.80 4.83
