Five-year peak performance
This criteria is simply the player’s best five-season average OPS+. Here are the 10 best among the 30 candidates.
Rank Center fielder Seasons Average
1 Mike Trout 2015-2019 183.0
2 Jim Edmonds 2000-2004 157.0
3 Ken Griffey Jr. 1993-1997 156.6
4 Andrew McCutchen 2011-2015 151.8
5 Bernie Williams 1997-2001 147.0
6 Dale Murphy 1983-1987 145.6
7 Cesar Cedeno 1972-1976 142.8
8 Eric Davis 1986-1990 142.6
9 Fred Lynn 1975-1979 140.4
10 Chet Lemon 1978-1982 138.6
If any category would favor a still-in-his-prime player like Mike Trout over those who had completed full-career resumes, it would be this peak-based one. And indeed Trout comes out ahead, beating the two logical closest competitors, Edmonds and Griffey.
His 183.0 average is astonishingly high for a five-season period, but not surprising to anybody who has watched him. Trout produced a 198 OPS+ — essentially doubling the performance value of an average player – in 2018 and was above 180 in both 2017 and 2019.
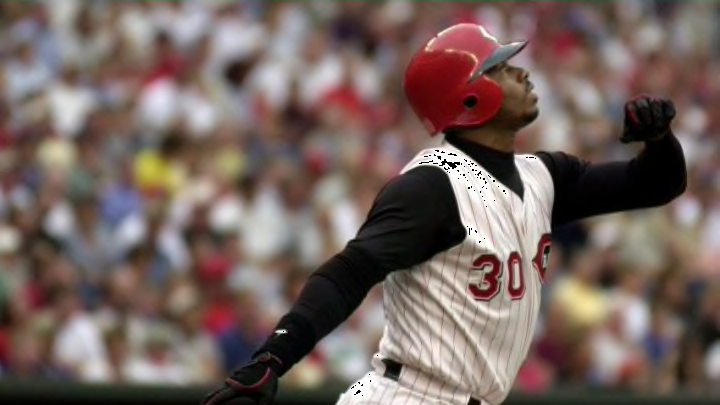
As the data suggests, the difference between Edmonds and Griffey was microscopic. At their respective peaks, both topped out at a 171 OPS+, Griffey doing so in both 1993 and 1994. But Griffey had – by his standards – an off season in 1995 when he missed half the season due to injury. That dropped his OPS+ to 122.
Edmonds had no such anomalous season to drag down his score…in fact, during his peak seasons, his low OPS+ was 147. That is solidly at an All-Star level.
Possibly the big surprise in this category was Chet Lemon, often overlooked today but a solid performer with the late 1970s and mid 1980s White Sox and Tigers. Between 1978 and 1982, Lemon produced five seasons above a 120 OPS+, peaking at 155 in 1981.
