MLB all-time lists: The expansion era’s 10 best starting pitchers

Enough Hall of Fame starting pitchers have populated baseball’s expansion era to overflow even a modern staff. A total of 17 starters whose careers peaked since 1969 have already been elected, so coming up with another entry for MLB all-time lists from that era will be a tough job.
That doesn’t consider several active or recently retired pitchers who are on track to attain that same status.
Among that elite group of starters, who stands out as the best? Is it Pedro Martinez? How about Randy Johnson? Roger Clemens, Greg Maddux and Tom Seaver have to be considered. Or might Clayton Kershaw have already done enough to outshine all of them.
MLB Network personalities Brian Kenny and Bob Costas considered the question of the era’s best starters during the sixth installment of the network’s Top 10 Right Now Thursday. That episode included a segment rating post-1969 starters.
Related Story. A Rogues Gallery Hall of Fame. light
As difficult as the challenge of picking one “best” starter may sound, Kenny and Costas did agree, at least at the top. Both selected Seaver, star of the New York Mets and Cincinnati Reds, for that honor.
But does Seaver really deserve to be placed at the head of such a crowded class of greats? Making that determination is the focus of this essay.
Before assessing how accurate the Kenny and Costas lists were, here are their respective top 10s:
| Brian Kenny | Bob Costas |
|---|---|
| 1. Tom Seaver | 1. Tom Seaver |
| 2. Randy Johnson | 2. Pedro Martinez |
| 3. Pedro Martinez | 3. Roger Clemens |
| 4. Greg Maddux | 4. Randy Johnson |
| 5. Clayton Kershaw | 5. Greg Maddux |
| 6. Roger Clemens | 6. Steve Carlton |
| 7. Phil Niekro | 7. Jim Palmer |
| 8. Gaylord Perry | 8. Nolan Ryan |
| 9. Justin Verlander | 9. Tom Glavine |
| 10. Jim Palmer | 10. John Smoltz |
The demands placed on a starter have evolved considerably over the past half century. Most obviously, starters are asked to work less frequently. In 1970, Gaylord Perry started 40 games and pitched 329 innings. In the modern game, a starter is considered heavily used if he logs 33 starts and 180 innings.
Today’s starter is also asked to be more of a strikeout pitcher; a half century ago, starters were allowed to rely on their fielders.
Our five ratings criteria attempt to recognize and balance those changes. When all five categories are assessed, the player with the average ordinal score closest to a perfect rating of 1.0 is the winner.
The criteria are:
- Five-year peak performance with ERA+ as the yardstick
- Cumulative ERA+ over the course of their careers
- Career Cy Young shares
- Strikeouts, with an era-based adjustment
- Innings pitched, also with an era-based adjustment.
Alphabetically, the 30 nominees are: Bert Blyleven. Kevin Brown, Steve Carlton, Roger Clemens, Tom Glavine, Dwight Gooden, Zack Greinke, Ron Guidry, Roy Halladay, Felix Hernandez, Orel Hershiser, Ferguson Jenkins, Randy Johnson, Clayton Kershaw, Greg Maddux, Pedro Martinez, Jack Morris, Mike Mussina, Phil Niekro, Jim Palmer, Gaylord Perry, David Price, Nolan Ryan, Johan Santana, Max Scherzer, Curt Schilling, Tom Seaver, John Smoltz, Don Sutton, Justin Verlander.
MLB all-time lists: Five-season peak performance
This criteria is simply the player’s best five-season average ERA+.
Here are the 10 best peak averages among the 30 candidates.
| Players (Seasons) | Average ERA+ |
|---|---|
| 1. Pedro Martinez (1999-2003) | 227.0 |
| 2. Greg Maddux (1994-98) | 213.8 |
| 3. Clayton Kershaw (2013-17) | 196.0 |
| 4. Randy Johnson (1997-2001) | 177.0 |
| 5. Kevin Brown (1996-2000) | 167.8 |
| 6. Roger Clemens (1990-94) | 166.0 |
| 7. Johan Santana (2002-06) | 159.4 |
| 8. Tom Seaver (1969-73) | 158.4 |
| 9. Max Scherzer (2015-19) | 157.2 |
| 10. Justin Verlander (2016-20) | 154.4 |
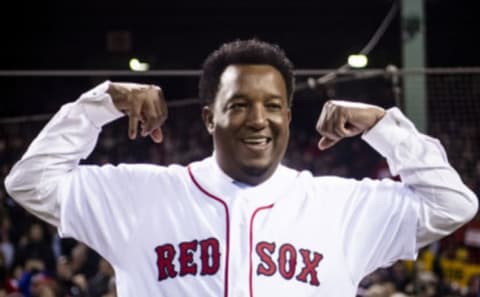
Pedro Martinez’s 1999-2003 period has been frequently and justly hailed as among the great peak stretches in the game’s history. In four of those seasons, his ERA+ surpassed 200; in civilian terms, that means Martinez was twice as good as the normal pitcher. In that context, his place at the top of this category is unquestioned.
Greg Maddux had extraordinary back-to-back seasons in 1994-95, highlighted by ERAs of 1.56 and 1.63. His 166 and 170 ERA+ ratings for those seasons are enough to slot him second.
The entire roster of starter categories is so laden with talent that it’s hardly possible for this or any other category to contain surprises. Perhaps Kevin Brown’s dominance between 1996 and 2000 qualifies. In that period, Brown compiled an 82-41 record, winning two ERA titles.
The most notable omissions from this list may be Steve Carlton and Nolan Ryan. Carlton’s peak seasons came from 1977-81, but only resulted in a 139.6 average ERA+. That was just good for 22nd place among the 30.
Ryan’s peak came between 1977-81, when among other things he became the first $1 million player. Still his average OPS+ for that period was 129.0. That’s good, except in this crowd, where it ranks 29th out of 30.
MLB all-time lists: Cumulative career ERA+
This category, which is simply the sum of each starter’s ERA+ values, is different from the standard career ERA+, which is essentially the player’s career average. Cumulative career ERA+ is designed to reward longevity. It is essentially a counter-balance to the first, peak-performance oriented, category.
Here’s the top 10.
| Player | Cumulative ERA+ |
|---|---|
| 1. Roger Clemens | 3,554 |
| 2. Greg Maddux | 3,163 |
| 3. Randy Johnson | 2,912 |
| 4. John Smoltz | 2,888 |
| 5. Nolan Ryan | 2,852 |
| 6. Pedro Martinez | 2,756 |
| 7. Phil Niekro | 2,691 |
| 8. Bert Blyleven | 2,590 |
| 9. Tom Seaver | 2,584 |
| 10. Don Sutton | 2,550 |
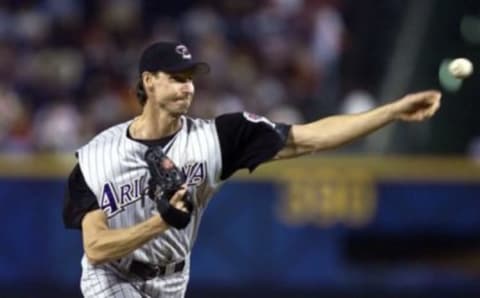
Roger Clemens lasted 24 seasons, and eight times had his league’s best ERA+. The timing of his excellence was fascinatingly diverse: Scores of 211 at age 27, 222 at age 34 and 226 at age 42.
Greg Maddux was a five-time leader in ERA+. Randy Johnson won six ERA+ titles, five of them after age 35.
Given the seasons spent in the bullpen, is John Smoltz’s status so high in this category surprising? That period actually helped him. In 2003, when Smoltz made 62 relief appearances and no starts, he had a 1.12 ERA over 64 innings, creating a freaky 385 OPS+. While his 141 peak rating encompasses only his years as a starter, his cumulative career total is boosted by that and one or two other inflated relief ratings.
MLB all-time lists: Cy Young shares
Peer and contemporary recognition is one important tool for measuring a player’s skill. This category is designed to factor that into the overall evaluation. For starting pitchers, the obvious best yardstick is Cy Young Award shares.
Each player’s Cy Young share is based on the percentage of available Cy Young votes he received during the course of his career.
Here’s the ranking of the 10 highest shares among the 30 players who were considered.
| Player | Cy Young Shares |
|---|---|
| 1. Roger Clemens | 7.66 |
| 2. Randy Johnson | 6.50 |
| 3. Greg Maddux | 4.92 |
| 4. Clayton Kershaw | 4.58 |
| 5. Steve Carlton | 4.29 |
| 6. Pedro Martinez | 4.26 |
| 7. Justin Verlander | 4.21 |
| 8. Max Scherzer | 4.07 |
| 9. Tom Seaver | 3.85 |
| 10. Jim Palmer | 3.57 |
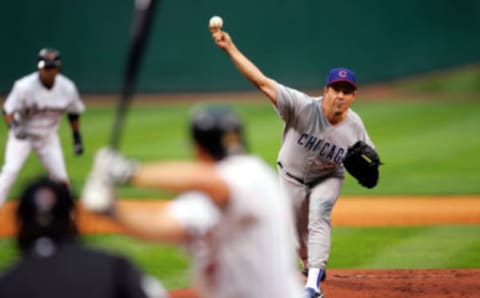
The top of this category is a Who’s Who of Cy Young Award winners. The top six took home a combined 26 Cy Youngs, nine of them in unanimous fashion. Here’s the count.
- Roger Clemens won seven Cy Young Awards, in 1986, 1987, 1991, 1997, 1998, 2001 and 2004. The 1986 and 1998 awards were unanimous.
- Randy Johnson won five of them, four in succession between 1999-2002, winning unanimously in 2002.
- Greg Maddux won four straight between 1992-95, his 1994 and 1995 awards coming unanimously.
- Clayton Kershaw won three times between 2011-14, the final award coming unanimously.
- Steve Carlton also took home four Cy Youngs, winning unanimously for his 27-10 season in 1972.
- Pedro Martinez won three times between 1997-2000, the latter two coming unanimously.
MLB all-time lists: Era-adjusted strikeouts
For better or worse, perhaps no aspect of baseball has risen in importance over the last half century as the whiff.
For most of the game’s history, a batter striking out was frowned upon, while pitcher strikeouts were prized. But with the rise of sabermetric analysis, the strikeout became an acceptable price to pay in exchange for a perceived power increase. As a result, pitcher strikeouts soared.
That profound change requires a refinement in our formula. Each pitcher is rated based on the percentage of his strikeouts per nine innings he worked measured against a pre-determined average for his peak decade. That decade average has risen from 5.1 in the 1970s to 8.1 in the just-completed decade.
Using Bert Blyleven as an example, here’s how it works. Blyleven, whose peak seasons came in the 1970s, averaged 6.7 strikeouts per nine innings. The decade average was 5.1. That puts Blyleven at 131.4 percent of the decade average. His score is 131.4. For the record, that leaves Blyleven in a tie with Ron Guidry for seventh place.
Here are the top 10 for starters since 1969.
| Player | Era-adjusted K/9 percentage |
|---|---|
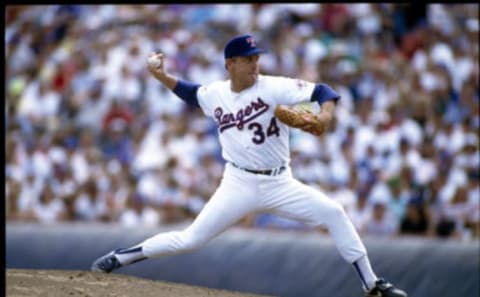
| 1. Nolan Ryan | 186.3 |
| 2. Randy Johnson | 168.3 |
| 3. Pedro Martinez | 149.3 |
| 4. Roger Clemens | 136.5 |
| 5. Dwight Gooden | 134.5 |
| 6. Tom Seaver | 133.3 |
| 7 (tie) Ron Guidry | 131.4 |
| 7 (tie) Bert Blyleven | 131.4 |
| 9. Johan Santana | 131.3 |
| 10. Max Scherzer | 130.9 |
MLB all-time lists: Era-adjusted innings pitched
The expectations placed on a starter have diminished so substantially over the past half century that – as with strikeouts – some sort of era-based adjustment is necessary to create a fair gauge.
The method used here is to devise a decade-average workload for a front-line starter, calculate the 162-game average for each starter and compare that figure against the norm for the decade in which that starter reached his peak.
The result will be a percentage. As an example, Johan Santana averaged 214 innings for every 162 games his teams played. Santana’s prime occurred in the first decade of the 21st century, when the average heavy workload was 223.2 innings. Santana’s score for this category becomes 214 divided by 223.2, or 95.54 percent.
With that as an understanding, here are the top 10 starters based on their innings workload compared with their era norms.
| Player | Era-adjusted innings pitched percentage |
|---|---|
| 1. Justin Verlander | 112.56 |
| 2. Clayton Kershaw | 112.06 |
| 3. David Price | 109.55 |
| 4. Max Scherzer | 108.04 |
| 5. Zack Greinke | 104.52 |
| 6. Roy Halladay | 103.57 |
| 7. Roger Clemens | 101.72 |
| 8. Jack Morris | 99.18 |
| 9 (tie) Randy Johnson | 99.14 |
| 9 (tie) Kevin Brown | 99.14 |
Moderns, who carry a disproportionate share of workload for the current game, dominate this list.
Between 2011-20, the decade average for a heavy-workload pitcher was about 199 innings. Justin Verlander, Clayton Kershaw, David Price, Max Scherzer and Zack Greinke all routinely topped the 200-inning mark, prompting their rise to the top of the category list.
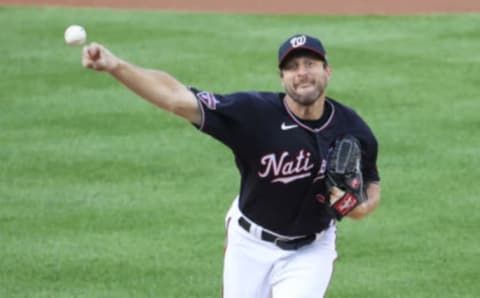
Comparative workload afforded Scherzer a particular advantage in the overall evaluation of starters. Entering this fifth category, four pitchers – Scherzer, Greg Maddux, Pedro Martinez and Tom Seaver – had been top 10 in at least three of the prior four.
Scherzer placed eight spots ahead of Maddux in this category, 11 ahead of Martinez and 15 ahead of Seaver, none of whom were as heavily used relative to the norms for their eras.
MLB all-time lists: The final tabulation
The tabulation below is based on the average ordinal placement of each of the 30 starters in all five categories. A score of 1.0, indicating a first place rank in all five categories, would be perfect. The list also shows the starter’s standing on the Brian Kenny and Bob Costas lists.
| Player | Ordinal Average | Brian Kenny | Bob Costas |
|---|---|---|---|
| 1. Roger Clemens | 3.80 | 6 | 3 |
| 2. Randy Johnson | 4.00 | 2 | 4 |
| 3. Greg Maddux | 4.40 | 4 | 5 |
| 4. Pedro Martinez | 6.40 | 3 | 2 |
| 5. Clayton Kershaw | 8.80 | 5 | NR |
| 6. Tom Seaver | 10.60 | 1 | 1 |
| 7. Justin Verlander | 11.80 | 9 | NR |
| 8. Max Scherzer | 12.40 | NR | NR |
| 9. Curt Schilling | 14.40 | NR | NR |
| 10. Roy Halladay | 15.00 | NR | NR |
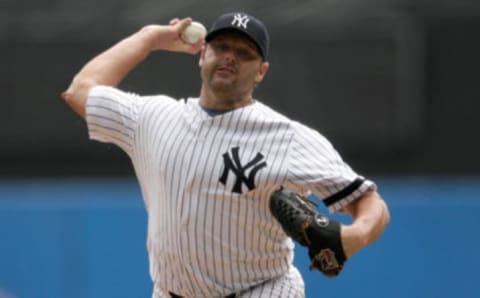
Roger Clemens got only third place love from Costas, and ranked just sixth on Kenny’s list. But he emerged first in this ordering by leading two categories – cumulative ERA+ and Cy Young Shares – and placing no lower than seventh in the others.
But his margin over Randy Johnson and Greg Maddux is small enough to leave plenty of room for debate. Beyond that, it’s entirely reasonable to penalize Clemens for steroid use and drop him several places on the ranking, as Kenny and Costas may or may not have done.
As for Tom Seaver’s presence atop their lists, well, differences of opinion make horse races. In the five categories applied here, Seaver never ranked higher than sixth. His candidacy was also damaged by workloads that were unremarkable for his era.
Still, in some order both Kenny and Costas nailed the top four, and Kenny included the top seven on his list. Kenny’s biggest omission was Scherzer, who ranks eighth.
His most curious choice was his anointing of Phil Niekro as the seventh-best pitcher of the expansion era. That’s just kind of baffling. Among these 30, and using these criteria, Niekro ended up dead last, placing higher than 20th only in cumulative career ERA+.
He also included Gaylord Perry in his top 10; Perry ranked 25th on this list.
Best third baseman of the expansion era. dark. Next
Both Costas and Kenny put Jim Palmer among the era’s 10 best. That’s reasonable, although on this list Palmer only finished 15th. Costas also included Nolan Ryan, Steve Carlton, Tom Glavine and John Smoltz. On this list they finished 16th, 18th, 19th and 22nd, respectively.