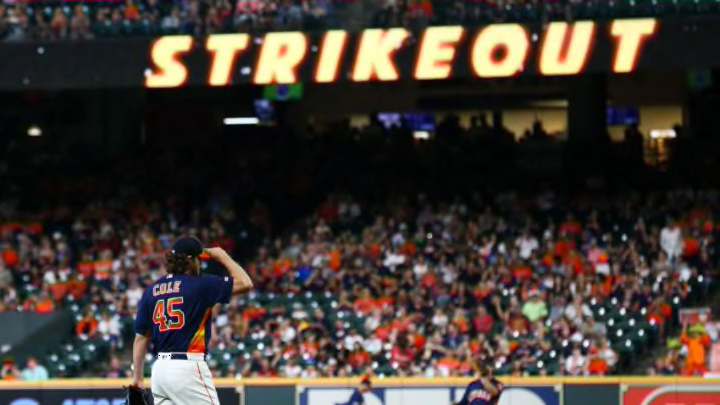
Is three weeks into the MLB season two soon to worry about a striking trend in baseball? Not if that trend has to do with strikeouts.
The topic of bat-on-ball contact, or lack of same, has become a hot one throughout the game since the end of the 2020 season. Manager after manager came to spring training vowing to emphasize putting the ball in play.
MLB has a striking problem
MLB itself took steps to underscore its concern about strikeout rates. It enacted several experimental rules changes at the minor league level designed to improve the level of action, the most recent of which – approved just this week – will tinker with moving the mound back a foot.
If the early 2021 data is any indicator, all those concerns are well-founded. Three weeks into the season, strikeouts are up dramatically and on pace to shatter existing records for frequency.
Through games of April 15, major league batters had fanned 3,397 times in 13,931 plate appearances. That’s a 27.65 percent whiff rate…better than one of every four batters.
The all-time record, set just last season of course, is 23.44 percent. That makes the pace of increase more than four percentage points in just one season.
There’s obviously a long way to go in 2021, and it’s possible that the strikeout rate may modify over time. But it’s also possible, and beginning to approach statistical likelihood, that it doesn’t modify much.
Actuaries – people who deal with probability for a living – will tell you that if you have an objective cross-section representing seven percent of the data universe, you can at least begin to draw conclusions…albeit with some margin for error – regarding that universe. The 13,931 plate appearances registered through Thursday represents 7.5 percent of the total number of plate appearances in 2019, the last full big league season.
That season, for the record, 22.96 percent of plate appearances were strikeouts. That’s about 4.5 percentage points less often than this season to date.
Of the five teams stuck with a strikeout rate of 27 percent or higher to date – those being the Cubs, Phillies, Orioles, Rangers and Tigers — none has a winning record and only the Phillies were playing .500 ball.
Conversely, the three teams that have gotten off to the hottest starts this season – the Dodgers (11-2), Red Sox (9-4) and Padres (9-5) – all are among the six toughest teams to strike out. San Diego, with a 17.5 percent fan rate – is No. 1.
Seven teams – the Giants, Cubs, Rangers, Orioles, Athletics, Royals and Marlins – are on pace to strike out at least six percent more frequently than they did just five seasons ago. By contrast, only four teams – The Padres, Astros, Dodgers and Diamondbacks — have seen their strikeout rate decline from 2016 to 2021.
In the case of the Cubs, who won the 2016 World Series – that says a lot. In 2016 Cubs hitters struck out 17.7 percent of the time. Their 2021 rate is now at 29.4 percent, a jump of 8.3 percentage points.
For the record, Chicago’s home run rate is basically unchanged: 3.13 percent in 2016, 3.14 percent thus far in 2021.
There are those who dismiss the strikeout as a necessary evil in the pursuit of the home run. But the Cubs’ experience Is not unique; all across baseball strikeouts are increasing at a rate far greater than home runs – which have barely increased at all in frequency over the past five seasons. They’re also vastly outstripping the third component of the “Three True Outcomes,” bases on balls.
The table below shows the percentage of all plate appearances consumed by each of the Three True Outcomes in 2016 and in 2021 to date. It also projects the same percentages looking ahead to the 2027 season assuming the present rate of change holds. In the final two columns, it shows the percentage of all plate appearances represented or projected to be represented by the Three True outcomes for each of the seasons, and the percentage of the Three True Outcomes represented by strikeouts.
Season BB HR K 3True% K%/3T%
2016 8.17 3.04 21.04 33.25 65%
2021 9.28 3.08 27.65 40.01 69%
2027 10.54 3.12 36.34 50.00 73%
These projections ought to scare the sanitaries off any true baseball fan. In 2016, the Three True Outcomes constituted only about one-third of all plate appearances. This year they are on course to constitute 40 percent, and climbing at a rate that would reach 50 percent by 2027.
And most of that growth is taking place in strikeouts. In 2016, strikeouts represented 65 percent of the True Outcomes. But this season they are on pace to make up nearly 70 percent, projecting to approach 75 percent by 2027.
Bases on balls would increase some, but home runs would increase only fractionally, if at all.
Question: Is there anything duller than a swing-and-miss game? Yet that is precisely the game trend today. And it’s why MLB is considering what some might view as radical changes to the game’s structure.
