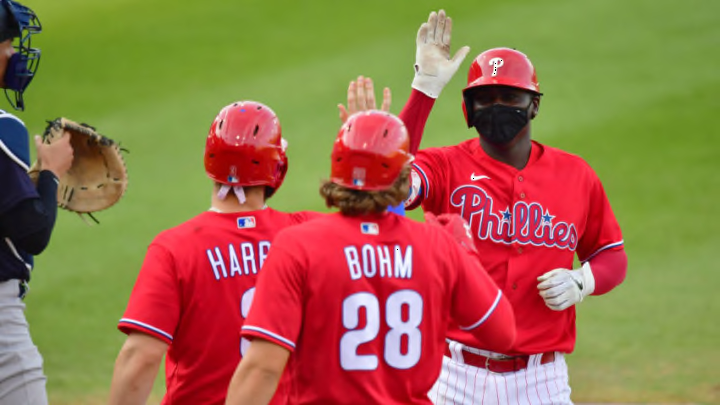
It went on for the Philadelphia Phillies for three days. From Apr. 25 through 27, they scored only two runs a game, two in a loss to Colorado, two in a somewhat miraculous win over St. Louis (since the losing pitcher threw a complete game), and two in a loss to the Cardinals.
Sports talk radio and the post -game analysts in Philly were moaning incessantly. The morning after the second of these losses, the first article highlighted on Phillies.com was entitled “Phils’ bats can’t find spark” on the home page, a marginal difference from the title behind the link, which referred to the Phillies skipper, Joe Girardi, invoking some needed luck.
Since two of the three games had resulted in losses, no one was even happy that in two of the contests, two different players had homered twice. One of those home runs had been a 468-foot, Bryce Harper moon shot in Denver.
Can a team’s offensive core be measured? A look at RBI core-five figures…
The Phillies were 11-12 despite their power hitters, and it was becoming clearer this was not only because of their stumbling fourth and fifth starters. There seemed to be another difference between them and top MLB teams that might be quantifiable even early in a season.
So, a touch of wonkiness drove me to examine a couple of data points not regularly perused for the Phillies and the Los Angeles Dodgers, who were 15-9 on the morning of Apr. 28.
On that day, the Phillies had five qualified hitters, as sorted by MLB.com websites, who also happened to be their five RBI leaders. These hitters were also the qualified batting average leaders for the team, but their averages dropped like a stone, from Harper’s top figure of .329 to a low of .198, posted by Didi Gregorius.
Those five qualified hitters – basically the team’s core offense – were averaging 11.8 RBI and playing an average of 22.2 of the Phillies’ 23 games through Apr. 27. Thus, each of those in the Phillies core offense was driving in 0.53 runs per game – slightly better than one run for every two games.
How different were these figures from the Dodgers’ numbers at that point? LA had only five qualified hitters then, and their BAs ran between Max Muncy’s .239 and Justin Turner’s .341.
(Side note that may be significant – Apr. 28 the Phillies had six qualified hitters, but the sixth, Andrew McCutchen, was hitting only .154 with a mere six runs driven in.)
Back to the Dodgers core and how they were doing with driving in runs: Their BA leaders were averaging 12.4 RBI for the season thus far, with each player playing in an average 21.2 games. So, those batters were driving in an average of 0.58 runs, not all that much better than the Phillies, but actually closer to three runs per player every five games than Philadelphia was.
However, a little digging suggests that one of the Dodgers BA leaders should be replaced for this calculation – Mookie Betts was hitting for average, but had driven in only three runs through Apr. 27, whereas rookie Zach McKinstry, just barely “unqualified” through that date, had driven in 14. Substituting the rookie for the multi-millionaire drove the Dodgers core-five figure to 14.6 RBI on average (in an average 21 games), or 0.70 runs per core batter per game.
