The RBI core-five: The difference between .500 and winning?

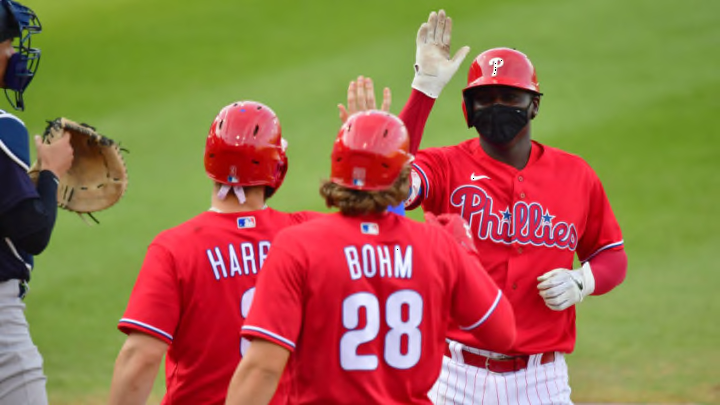
CLEARWATER, FLORIDA - MARCH 25: Didi Gregorius #18 celebrates with Bryce Harper #3 and Alec Bohm #28 of the Philadelphia Phillies after hitting a three-run home run in the first inning against the New York Yankees during a spring training game on March 25, 2021 at BayCare Ballpark in Clearwater, Florida. (Photo by Julio Aguilar/Getty Images)
2 of 3
Next
(Photo by Rich Schultz/Getty Images)
(Photo by Rich Schultz/Getty Images) /

It went on for the Philadelphia Phillies for three days. From Apr. 25 through 27, they scored only two runs a game, two in a loss to Colorado, two in a somewhat miraculous win over St. Louis (since the losing pitcher threw a complete game), and two in a loss to the Cardinals.

Sports talk radio and the post -game analysts in Philly were moaning incessantly. The morning after the second of these losses, the first article highlighted on Phillies.com was entitled “Phils’ bats can’t find spark” on the home page, a marginal difference from the title behind the link, which referred to the Phillies skipper, Joe Girardi, invoking some needed luck.

Since two of the three games had resulted in losses, no one was even happy that in two of the contests, two different players had homered twice. One of those home runs had been a 468-foot, Bryce Harper moon shot in Denver.

Can a team’s offensive core be measured? A look at RBI core-five figures…

The Phillies were 11-12 despite their power hitters, and it was becoming clearer this was not only because of their stumbling fourth and fifth starters. There seemed to be another difference between them and top MLB teams that might be quantifiable even early in a season.

So, a touch of wonkiness drove me to examine a couple of data points not regularly perused for the Phillies and the Los Angeles Dodgers, who were 15-9 on the morning of Apr. 28.

On that day, the Phillies had five qualified hitters, as sorted by MLB.com websites, who also happened to be their five RBI leaders. These hitters were also the qualified batting average leaders for the team, but their averages dropped like a stone, from Harper’s top figure of .329 to a low of .198, posted by Didi Gregorius.

Those five qualified hitters – basically the team’s core offense – were averaging 11.8 RBI and playing an average of 22.2 of the Phillies’ 23 games through Apr. 27. Thus, each of those in the Phillies core offense was driving in 0.53 runs per game – slightly better than one run for every two games.

How different were these figures from the Dodgers’ numbers at that point? LA had only five qualified hitters then, and their BAs ran between Max Muncy’s .239 and Justin Turner’s .341.

(Side note that may be significant – Apr. 28 the Phillies had six qualified hitters, but the sixth, Andrew McCutchen, was hitting only .154 with a mere six runs driven in.)

Back to the Dodgers core and how they were doing with driving in runs: Their BA leaders were averaging 12.4 RBI for the season thus far, with each player playing in an average 21.2 games. So, those batters were driving in an average of 0.58 runs, not all that much better than the Phillies, but actually closer to three runs per player every five games than Philadelphia was.

However, a little digging suggests that one of the Dodgers BA leaders should be replaced for this calculation – Mookie Betts was hitting for average, but had driven in only three runs through Apr. 27, whereas rookie Zach McKinstry, just barely “unqualified” through that date, had driven in 14. Substituting the rookie for the multi-millionaire drove the Dodgers core-five figure to 14.6 RBI on average (in an average 21 games), or 0.70 runs per core batter per game.

(Photo by Stacy Revere/Getty Images)
(Photo by Stacy Revere/Getty Images) /

What is the RBI Core-Five Gold Standard Figure?

This figure (0.70 RBI per core batter per game) obviously means that the Dodgers core-five were each driving in nearly three runs in every four games, while the Phillies were at two RBI for every four games per mainstay.

It also appeared that it might not be a good thing to have two qualified hitters below .200 at any point in the season except, say, the first three days. Oh, and have a rookie in the team top five for RBI who doesn’t quite play every day.

Moving forward, what would the coming week mean for the newly minted notion of the RBI core-five? It was time to track the Dodgers and Phillies a bit more…

Five days and games for each team later, the Dodgers, who had been tied for first in the West Apr. 27, were 17-12, and in second place, half a game behind San Francisco. After play May 2 the Phillies, who had been tied for second place in the East, were 13-15, and also in second, a game behind two allegedly underperforming, .500 teams, Washington and New York.

Both teams went 2-3 for their five-game stretches, hardly a shock for the Phillies of the past few years, but a little bit of a slide for the Dodgers. Nonetheless, LA remained on pace to win 94.97 games for the season. Philadelphia was on pace to win 75.21 games.

In that time, six players for each team were tracked – the first five in RBI before play Apr. 28, as well as each team’s nominal lead-off hitters, Betts and McCutchen. Note that Betts had the higher average then, McCutchen more RBI, but neither was considered among the core-five for these purposes.

Among the 60 player-games these 12 players could have appeared in those five days, 15 games were missed in total.

For the Phillies, Gregorius, Harper, and J.T. Realmuto, arguably the Phillies three best position players, were absent for all seven of the games missed by their RBI core-five. Harper had been hit with a 97-mph pitch that could have fractured a cheekbone or eye orbit, but instead hit his wrist and face, resulting in contusions instead of tragedy.

For the Dodgers, rookie McKinstry was on the injured list for all five games, while Betts, Muncy, and Corey Seager each missed a game.
Mandatory Credit: Mark J. Rebilas-USA TODAY Sports
Mandatory Credit: Mark J. Rebilas-USA TODAY Sports /

Can Five Games Be Reflected in RBI Core-Five Changes?

What happened in terms of the RBI core-five? For Philadelphia, their top five qualified RBI producers remained the same – Gregorius, Rhys Hoskins, Alec Bohm, Realmuto, and Harper. Harper and Realmuto had flipped their positions in the core-five. The group had continued to produce 0.53 runs per player per game, in large part because of a three-run homer by Bohm and two RBI from Hoskins in an 8-7 loss May 2 to the Mets.

So, until Apr. 27 the Phillies were a game under .500; between Apr. 28 and May 2 they went one game under .500. And their RBI core-five production remained steady.

The Dodgers situation was somewhat different, but their RBI core-five production also reflected a 2-3 performance. After the five games examined, their seasonal RBI core-five production slipped from 0.70 runs per game to 0.67 – still considerably better than the Phillies figure.

However, the make-up of LA’s RBI core-five had changed since Apr. 27. It now included two unqualified hitters, McKinstry and A.J. Pollack. That McKinstry stayed there should concern future Dodgers opponents – it means that his production before hitting the IL was so good – 0.82 runs per game – that he could afford to miss five games and remain among the team’s RBI leaders.

Pollack had leapt to the RBI core-five with eight RBI against the Brewers in LA’s blow-out 16-4 win on May 2.

Moreover, while the Dodgers had just weathered a rough stretch longer than their five games after Apr. 27, their RBI core-five, a changing group, had remained pretty steady in  terms of production, even with a couple of players jumping in and out of the top five.

In other words, LA’s RBI core-five was more like a core-seven. Just behind their top five were Muncy and Matt Beatty, both with 11 RBI, producing together 0.49 RBI per game – not miles from the Phillies’ “steady” core-five figure. Beatty was producing 0.61 RBI per game.

Thus, examining the RBI core-five notion, it seems that the difference between a mediocre team and a very good one is in pretty narrow range because of aggregating. It may be the difference between approximately 0.50 and 0.75 RBI per player per game for five, possibly changing hitters. Further number crunching is likely needed, though, to say whether a 0.50 RBI core-five figure generally predicts a team near .500.

Also, a top team may well not have a steady RBI core-five. The best squads may have a couple more players challenging for positions in that core – in other words, a potential lineup of seven productive hitters.

Next