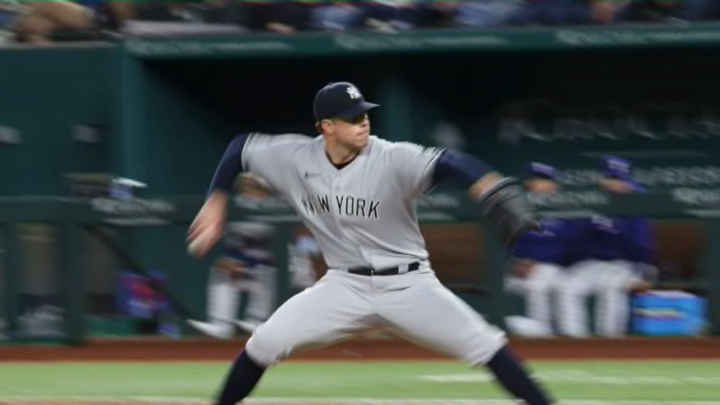
By now you’ve figured out that no-hitters are being hurled at a record rate in MLB these days. Joe Musgrove, Carlos Rodon, John Means, Wade Miley and Spencer Turnbull have all explained that in detail. And now, as of Wednesday night, so has Corey Kluber.
That adds up to six no-hitters by mid-May…and it doesn’t count Madison Bumgarner’s unofficial seven-inning no-hitter.
2021 – MLB’s new Year of the No Hitter
All we really need to do is reduce the season’s no-hit outburst to a comparative number to get a true feel for just how desperate the plight of the batter is these days.
The simplest number is this: With six no-hitters, we are already just one short of the all-time record for no-hitters in a single season. That record sits at seven. Pitchers accomplished that four times: 1990, 1991, 2012, and 2015.
But of course, pitchers had a full season to run up that many no-hitters. We’re barely a quarter of the way through the 2021 season. Let’s try a more revealing number…a ratio.
Thus far in 2021, there have been 1,274 team games played, defining a team game as one game played by one team. The six no-hitters then equate to one no-hitter every 212 team games. If that rate continues, the 2021 season will yield about 23 no-hitters.
During the 2012 and 2015 no-hit sprees, the comparable rate was one no-hitter for every 700 team games. That’s less than one-third the frequency of 2021 to date. In 1990 and 1991, the other two seasons with seven no-hitters, the rate was one for every 600 games. There were four fewer teams in existence in those seasons than in 2012 and 2015, thus about 1,200 fewer team games were played.
As you might guess, there is nothing in MLB history to approach the 2021 rate of no-hit production.
Although there were seven no-hitters in both 2012 and 2015, the most recent decade of baseball history has not been an especially abundant one for no-hit games. There were only one each in 2016 and 2017, and the rate for the decade of 2011-2020 was one no-hitter every 1,265 games. That’s only a bit more than average for a decade of baseball history.
The two most common decades for a no-hitter were the 1910s and 1960s, and even then the frequencies were merely one for every 929 and 963 team games respectively. In both cases that’s less than one fourth the frequency of 2021 no-hitters.
To find a season that’s even in the discussion, you have to go back to a time when not a soul on this Earth was alive.
Going all the way back to 1893, the first season when the 60-foot, six-inches pitching distance and mound were used, there have been only three seasons when the rate of no-hitters was less than one in 500 games. And all of those were in the dead ball era.
In order, here’s the list of the 10 seasons with the most frequent rates of no-hitters.
Season No-hitters Games Rate
2021 6 1274 1 in 212.33
1908 6 2488 1 in 414.67
1917 6 2494 1 in 415.67
1898 4 1842 1 in 460.50
1991 7 4208 1 in 601.14
1990 7 4210 1 in 601.43
1905 4 2474 1 in 618.50
1956 4 2478 1 in 619.50
1951 4 2478 1 in 619.50
1915 6 3728 1 in 621.33
It should come as no surprise that hitting generally is way off. The major league batting average for the first quarter of the 2021 season is about .236, on pace to set a new record low. Run-scoring has fallen as well. Teams are scoring just 4.36 runs per game so far in 2021, 10 percent fewer runs than in 2019 and the least productive season since 2015.
All of that suggests we haven’t seen the last of the season’s no-hit spree.
