Core-five RBI: The frustrating search for a new MLB metric

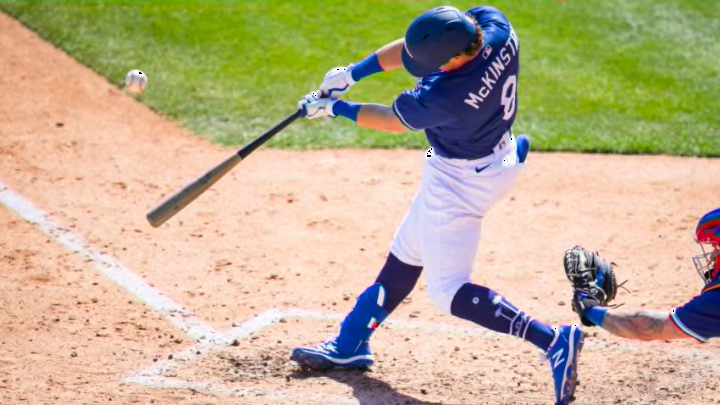
Mar 19, 2021; Glendale, Arizona, USA; Los Angeles Dodgers infielder Zach McKinstry against the Texas Rangers during a Spring Training game at Camelback Ranch Glendale. Mandatory Credit: Mark J. Rebilas-USA TODAY Sports
2 of 4
Next
Mandatory Credit: Orlando Ramirez-USA TODAY Sports
Mandatory Credit: Orlando Ramirez-USA TODAY Sports /

At the end of April, I had what’s known in the writing business as a “big idea.” It was inspired by a continuing anemic offensive performance by the Philadelphia Phillies – a modest streak of merely two runs a game. What was up with their core hitters? It came to me in a flash – honest – core-five RBI.

Wouldn’t the top five RBI producers be a team’s best hitters?

What was found by contrasting the performance of the Phillies and Los Angeles Dodgers was as follows – tentatively – with smallish samples: A top team like the World Series champion Dodgers has five players leading their RBI list who drive in between 0.67 and 0.70 runs apiece per game. A team hovering near .500 like the Phillies seemingly produces a figure around 0.53 RBI per leader per game.

Why not simply declare a new metric like core-five RBI? Is the idea dead, dying, or kind of breathing better?

Aggregate figures for about a month and then a work week (five games) for both teams were examined in this preliminary “study.”

But were the conclusions true? Was the difference between a world-beating MLB team and a mediocre squad really as narrow as a fifth of a run (0.20) per RBI leader (or one run per five-leader group per game)? Additionally, could five hitters actually predict a team’s success regardless of the strength of the team’s pitching and fielding?

That couldn’t be, could it?

What else was tentatively learned by looking at two contrasting teams? The very small team samples (four) examined shortly before Mother’s Day – merely two teams – very tentatively suggested that a .500 team could have a more stable core-five RBI group, but the top team might have perhaps seven or eight players battling to be part of the leader group of five.

In other words, the Phillies’ top five “qualified” hitters at the end of a month and at the end of the subsequent week were the same five guys. They drove in a consistent 0.53 runs per player per game.

The Dodgers, on the other hand, had an unqualified hitter in their top-five RBI group near the end of April (producing 0.70 runs per player per game), but two unqualified hitters in their top five after the end of roughly five weeks of the season (0.67 runs). The unqualified hitter in both samples, rookie Zach McKinstry, was driving in 0.82 runs per game before an injury shortly before May Day.

It shouldn’t be a shocker that really good teams find guys who drive in lots of runs despite not even playing every day, right?

Mandatory Credit: Kyle Ross-USA TODAY Sports
Mandatory Credit: Kyle Ross-USA TODAY Sports /

Moving Forward with the Study

How could this study be moved forward, given that I had mislaid my supercomputer and could not literally study every possible “top” team, every possible .500 team, and maybe even every last-place team at discrete moments in time for, oh, five years or so?

Perhaps randomly selected dates were the answer. First, I decided to examine first-place teams, the six division leaders on entirely random dates.

These first-place, core-five RBI snapshots were taken on May 3 for A’s and Red Sox, on May 5 for the Phillies, who briefly popped above .500 to take first place alone, and on May 7 for the Cardinals, Giants, and White Sox (all after play).

Here were the results for the division leaders – team on the left, Core-Five Production (RBI per player per game on average) in the middle, total unqualified hitters in parentheses on the right:

Team                    C5P

OAK                       0.58 (1)

BOS                        0.67 (1)

PHI                         0.53 (0)

CWS                       0.66 (1)

STL                         0.57 (1)

SFG                        0.49 (4)

So, how does all this line up with the notion that a top team’s core-five RBI leader produces over 0.67 runs per game? Well, the figures are not quite there, but the season was still young after play on May 7, and the only true outlier to the 0.67-0.70 range was San Francisco.

But let’s look at the other apparent outlier, Philadelphia, first. In all three snapshots, the Phillies core-five hitters were driving in 0.53 runs per player – in a nearly month-long snapshot, in a five-game look, and in another seasonal look at a bit over five full weeks. Thus, despite leading the division at 16-15, their core-five production consistently suggested mediocrity for the early season.

Their one good sign was that as their third snapshot was taken, Andrew McCutchen was able to replace an injured Bryce Harper in the team’s top-five without an aggregate fall-off in “team” production.

Was this a tentative sign of fluidity in their core-five for RBI, thought to be a good sign for a team? Time might tell.

But what was going on with the Giants, the NL West first-place team at 19-13 after play May 7? A paltry 0.49 core-five RBI per top hitter each game?

Did this figure foretell a plummet for San Fran at some point? And what could be made of the fact that their core-five appeared to be completely unstable – four players among their five leaders on track to be ineligible for a home run, batting, or RBI title???

Did the Giants just need a bit more time to establish their “character”?
Mandatory Credit: Kim Klement-USA TODAY Sports
Mandatory Credit: Kim Klement-USA TODAY Sports /

How about the True .500 Teams?

A little time was allowed to pass before the .500 teams were selected to examine. This allowed for speculative questions. Would the .500 teams be reasonably close to 0.50 core-five RBI a game per hitter?  What would the average figure be for the .500 teams?

Would that figure deviate from the middling 0.53 Phillies figure for 2021 thus far? If it rose, would the gap between an average .500 team figure and the average first-place team figure be so narrow that the whole study of core-five RBI by itself became meaningless? What were the aggregate first-place figures?

The average for the first-place teams selected on random dates turned out to be 0.583. If the earlier, weeks-long sample for the Dodgers is thrown in (0.70), the core-five figure for each “top” or first-place team’s hitter rises to exactly 0.600.

This means that what could be called Total Core-Five Production (TC5P), or the average number of RBI for the entire core-five group per game, for a first-place team, should be around 3.000.

Up until now we’ve been looking at individual RBI team-leader figures, Core-Five Production (C5P), that generally sub-1.000 figure per player among a team’s top-five RBI men.

The following .500 teams were chosen beginning after play May 16 (Reds) and concluded after play May 26 (Royals).  When there were multiple teams at .500 on a date chosen, the team was selected by coin flip/s (e.g., the Brewers were chosen over the Braves after play May 25).

Six teams were chosen for the sake of equal sample sizes, and for the final team, to reflect the “almost .500” status of the Phillies throughout this project, another “almost .500” team was included.

Team                     C5P

CIN                         0.67 (1)

CHC                        0.55 (0)

MIL                        0.50 (2)

TOR                        0.73 (1)

MIL                        0.46 (1)

KCR (23-24)         0.53 (0)

Crunching these figures, an average 0.573 RBI per game is observed, a “mediocre” team’s core-five RBI production per player (C5P). Adding the earlier snapshot of the Phillies (0.53), like the Dodgers’ weeks-long sample, moves the C5P figure slightly – down to 0.567 for “mediocre” teams (six .500 teams plus the one-game-under-even April Phils).

Again, tentatively speaking, this suggests a .500 team’s core-five group will give you 2.835 runs per game (TC5P) independent of the other team’s defense or pitching.

Clearly, in the early season, “mediocre” teams’ offensive production numbers are a free-for-all. (Oh, and the Blue Jays core-five drives in runs for real.)

Mandatory Credit: Charles LeClaire-USA TODAY Sports
Mandatory Credit: Charles LeClaire-USA TODAY Sports /

What Do the Cellar Dwellers Do?

While the random search for days with even one .500 team dragged on a bit, the last-place teams’ performance came under scrutiny. What do those teams trailing their divisional competition do in terms of core-five RBI? Is there a definable floor at the MLB level for “bad” teams, or could their core-five groups be, perhaps, more various?

And if that’s the case, is an average last-place team’s Core-Five Production (C5P and TC5P) less meaningful than those figures for better teams, or to put that another way, is their last-place rank more affected by poor defense and pitching?

The Results (May 23 – May 27 – seven teams again, two teams chosen one day, two others chosen the 27th from the remaining division needed and another on a coin flip between Texas and Detroit, the only two last-place teams different from those chosen from their divisions earlier):

Team                     C5P

BAL                        0.56 (0)

PIT                          0.42 (2)

MIN                       0.55 (3)

LAA                        0.58 (0)

WAS                      0.53 (1)

ARI                         0.56 (2)

TEX                         0.57 (0)

This yields a C5P of 0.538 and a TC5P of 2.690.

Thus, the difference between first place teams and last place teams is a mere 0.310 RBI per core-five group per game. The .500 teams, as it turns out, produce a mere 0.145 core-five RBI per game more than the last-place teams, and trail the first-place teams by only 0.165. And what can be made of the unqualified player snapshots? You got me.

Useless study?

Maybe not. The range between a very good pitcher’s WHIP and the one posted by a very bad one is only about 0.40 or 0.50, and yet that figure is probably on the scoreboard in an MLB park near you.

And C5P and TC5P are far more team measures than WHIP. However, at least early in the season the figures are not exactly predictive of success.

But what we kind of know now is that if your team’s core-five drives in 3.5 runs every game, that team is likely at least a .500 team. Likewise, if you’re stuck at .500 instead of being in first place, you likely have injury, pitching, or defense problems.

If, however, your team’s core-five are driving in fewer than 2.5 runs a game, you could be watching a first-place, .500, or last-place team.

If your core-five RBI men are driving in between 2.5 runs and 3.0 runs a game, and you’re not happy with that team, you’re back to defense, pitching, or injury problems. Your offense is just like everybody else’s.

Next. The core-five RBI. dark

Or, maybe, in a more muscular offensive season, the range between a last-place and first-place core-five RBI would spread out. How about a TC5P of 2.8 to 3.8, people? Start swinging at the good pitches, guys.

Next