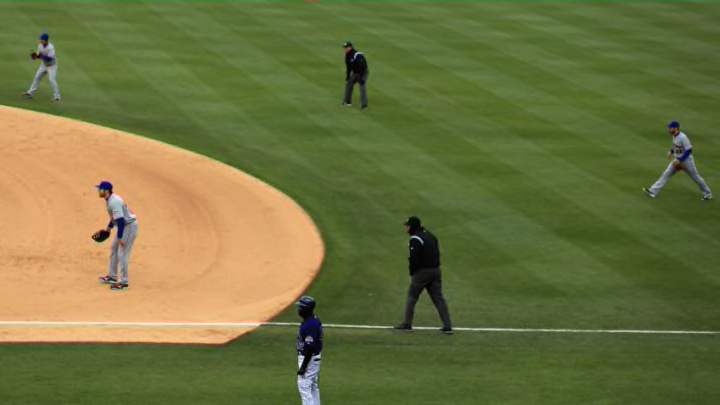
Looking for statistical data on the shift is not as easy as I had hoped. Of the publicly available shift data, the two best sources of information I found were at FanGraphs and MLB’s site Baseball Savant. The latter only provides statistical information for the number and percentage of plate appearances (PA) with the shift and the weighted statistic wOBA. FanGraphs has more detailed splits for the shift (both traditional and non-traditional) and will be the primary basis for the information in this article.
The reason a team would utilize a shift against a player would be to turn more balls in play into outs than would happen with a traditional defensive setup. Most commonly, the shift results in having an additional infielder on one side of second base to defend against ground balls hit by extreme pull hitters. At times, this has often resulted in one infielder turning into more of a roving outfielder in shallow left or right field. Other shifts like having four outfielders or a fifth infielder are much less common but still happen often enough in today’s game.
According to Baseball Savant, which has shift data going back to 2016, nearly 31% of PA had shifts in 2021. This number is a slight decrease from 2020 when it was 34% but is significantly increased from 2017 when it was 12.5%. Over the last two seasons, 52% of all PA by a left-handed hitter had some sort of shift while only about 17% of PA by a right-handed hitter did. Every single team in MLB employed a shift for at least 1 out of every 6 ABs over the past two seasons.
So how effective is the shift in Major League Baseball?
The common perception is that the shift works better against left-handed hitters than right-handed hitters and that is likely the reason why it is used three times as often against lefties. Baseball Savant confirms this as, according to that website, righties had a .340 wOBA (weighted on-base percentage) against the shift while lefties have a .320 wOBA in both 2020 and 2021. The league average wOBA in 2020 was .320 and in 2021 was .314. If those numbers are accurate, over the past two seasons lefties have had a slightly higher wOBA against the shift than with no shift and righties have had a significant advantage.
I am a fan of the wOBA statistic as it weights every significant event that goes into a batting line based on the run expectancy of that event. Still though, as good as wOBA is, no one statistic in baseball tells the full story. FanGraphs provides more data across the league and for each individual and has shift data dating back to 2010. At that site, they focus solely on balls that are in play and eliminate home runs, walks, hit by pitches, and strikeouts from a players’ record. The result of this is a record that includes batting average on balls in play (BABIP), hits, doubles, triples, and ground into double plays.
