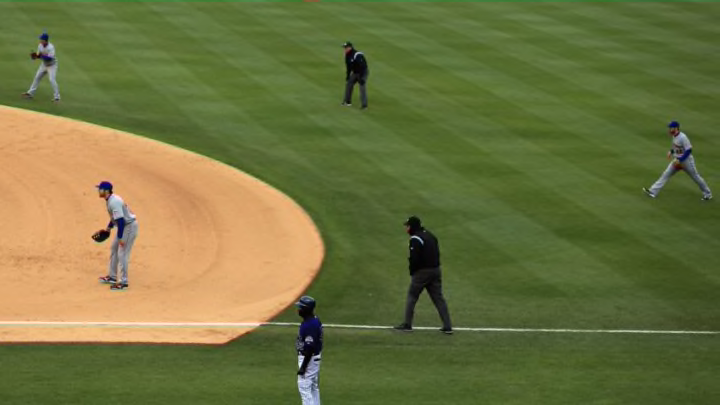
BABIP is a statistic that focuses on the batting average of only balls in the field of play, eliminating HR, BB, K, and HBP from the equation while also accounting for sacrifice flies. Focusing on the data since 2016, the BABIP for PA against a shift has been .296 whereas the BABIP with no shift has been .297. This is over no small sample size either, in those six seasons there have been over 600,000 balls put in play with or without a shift.
Looking even deeper at the numbers, however, there appears to have been a shift, so to speak, in the last two years. From 2016 to 2019 the league had a higher BABIP against the shift (.301) than with no shift (.297), actually providing an advantage to the hitter being shifted against. Over the last two seasons that advantage has flipped and the league BABIP against the shift has lowered to .288 while the BABIP with no shift has remained the same (.297). The league BABIP for this last period was around the midpoint of these two scenarios, .292. For the last two seasons, the shift has taken away a hit about 1 out of every 100 times a player puts a ball in play across the league, or a 1% reduction.
Are extra-base hits harder against the shift in Major League Baseball?
The Gallo quote earlier in the article states that it’s harder to get extra-base hits against the shift than with a traditional defensive alignment. Over the last six seasons, against a shift, 26.3% of all hits (excluding home runs) have been for doubles or triples. With no shift, 25.3% of hits have been for extra bases. Even over the last two seasons, when the tides have turned ever so slightly for BABIP, 26.5% of hits against the shift have been for extra bases while only 23.9% with no shift have had that result. The data states that extra-base hits happened about 10% more often against the shift since 2020 and about 4% since 2016.
