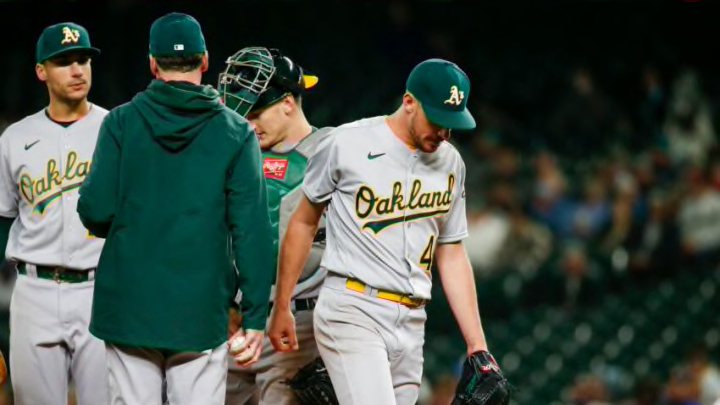
The outcome of a baseball game is becoming more and more arbitrary, and the reason is simple. MLB teams have an increasing reliance on the most volatile, least predictable aspect of their makeups — their bullpens.
General managers and field managers across the game’s landscape have known for years that they are playing a fool’s game when they try to build a team’s success around its most arbitrary component, the bullpen. That’s why fewer teams today commit long-term money to relievers.
But as they continue to devote more in-game innings to those same relievers, they ignore their own team-building advice by placing increasing responsibility for the outcomes of games in the arms of those most arbitrary elements.
Although not the only reason, relying on the bullpen is one of the reasons why there are no true dynasties in MLB today.
Over the last eight seasons, no team has won the biggest prize, the World Series, more than once. That matches the longest such period in the history of the World Series.
There hasn’t been a repeat champion since the New York Yankees won three straight more than two decades ago. The longest previous stretch without a back-to-back winner was just 13 years, 1979-1991. MLB broke that record when the Boston Red Sox failed to repeat back in 2014.
Connecting the dots to identify the increasingly arbitrary nature of game outcomes is easy. Just look at the increase in innings devoted to baseball’s least predictable aspect.
In 2000, those pitchers with workloads of 100 innings or more accounted for an average of 773 innings per team, or about 54 percent of all innings pitched. Last season, pitchers with workloads of 100 innings or more only accounted for an average of 578 innings per team, a drop-off of nearly 200 innings or close to 25 percent.
The arbitrary nature of the impact of that strategic shift can be clearly quantified by a bit of math. In 2000, the correlation between the number of innings worked by 100+ innings pitchers and a team’s wins measured 53 percent. That’s a significant, if not a dominant, correlation.
By last season, that same correlation between innings worked by each team’s 100+ innings pitchers and that same team’s victory total had plummeted to just 31 percent, a fairly striking 42 percent weakening of the relationship.
The lesson here should be simple; the less you use your best pitchers, the more you leave your team’s fate to arbitrary factors … which means luck.
At the level of the individual pitcher, the same arbitrary performance pattern emerges. There were 78 pitchers used primarily or exclusively in relief who met two conditions: they pitched at least 50 innings in 2021, and at least 19 innings (the short-season equivalent of 50) in 2020.
We can gauge the performance variations of these 78 relievers by looking at their Win Probability Added for both seasons (again multiplying the 2020 numbers to get an apples-to-apples comparison).
Here’s what that data shows.
Of the 78, the WPA performance of 16 varied by at least 3.0 between those two seasons, and the WPA performance of an additional 18 varied by at least 2.0. In short, the WPAs of 44 percent of those 78 pitchers swung by at least two games between 2020 and 2021.
And some of the most respected relievers experienced some of the largest performance shifts. The other night, the MLB Network unveiled its list of the top 10 relievers right now. Six of the 10 names on that list are among the 78 who met the usage standards for 2020 and 2021 mentioned above. The chart below shows the variation in the performance of those six between 2020 and 2021, again with 2020’s short-season data WPA multiplied to equate to 2021.
Pitcher (Rk) 2020WPA 2021WPA Change
Josh Hader (1) 1.4 4.8 3.4
Liam Hendriks (2) 7.6 1.9 -5.7
Devin Williams (3) 5.1 2.7 -2.4
Ryan Pressly (5) -1.1 3.1 4.2
Raisel Iglesias (7) 1.4 3.7 2.3
Jonathan Loaisiga (10) 0.8 3.3 2.5
Without exception, the performance of the six — all judged to be front-line relievers — varied by more than two games worth of Win Probability Added just between a normalized 2020 and 2021. It’s also noteworthy that the direction of their performance variation was arbitrary: four improved but two declined.
Hendriks, rated by MLBTV as the second-best reliever today, also shows out to be the fourth-most volatile in his performance. His swing of 5.7 WPA was exceeded in volatility only by Alex Colome (-6.6), Kyle Finnegan (-6.3), and Cole Sulser (+5.8).
The ranks of relievers whose performance, as measured by WPA, declined the most in 2021 is a stellar one indeed. In addition to Hendriks, Colome, and Finnegan, it includes such respected names as Brad Hand (-5.5), Nick Wittgren (-5.2), Greg Holland (-4.8), and Alex Reyes (-3.5).
The lesson is an obvious one. As MLB teams spread the responsibility for getting outs across a broader swath of pitchers, they reduce their own out-getting efficiency and, in so doing, increase the arbitrary nature of the outcome of a ballgame.
If you are of a school that believes any team, even a mediocre one, should have a chance to win, you may view that as a good thing. But if you believe the championship ought to be decided on the basis of skill rather than arbitrary factors, this trend is a bad thing.
