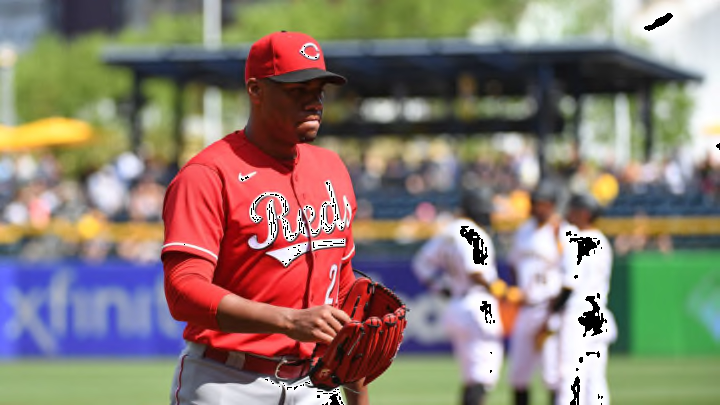
Can we get past the false narrative that Cincinnati Reds pitchers Hunter Greene and Art Warren combined to lose a no-hitter Sunday?
They didn’t. Under Major League Baseball rules, to be recognized as an official no-hitter one team has to be held hitless for at least nine innings. The Pittsburgh Pirates never batted in the ninth inning, making what Greene and Warren did something other than a no-hitter.
Beyond that, as recent no-hitters go it wasn’t all that great a pitching performance anyway.
How Cincinnati Reds performance on Sunday rates in MLB history
Since the start of the 2017 season – that’s five seasons plus part of this one – there have been 21 official no-hitters thrown. That doesn’t count Greene-Warren and it doesn’t count Madison Bumgarner, who threw what was referred to as a ‘seven inning no-hitter’ last April against Atlanta. (It was the second game of a double-header, and in 2021 doubleheaders were notoriously presented as seven-inning games.)
It does count combined no-hitters, of which there have been a half dozen.
There are two good ways to isolate and measure the quality of a pitching performance these days. The first is Game Score, a statistic created by Bill James that assigns a numerical value to a starter’s work based on innings pitched, runs allowed, strikeouts and a few other elements. The gold standard in that category was Kerry Wood’s famous 20-strikeout one-hitter against Houston back in May of 1998, which scored at 105.
The second is Win Probability Added, a more recent SABRmetric calculation of the percentage of contribution to a victory made by each player. On the WPA scale, a score of 1.00 – which never happens – would be optimal.
Here’s the thing. On both scales, the Greene-Warren effort of Sunday looks relatively puny compared with the average of the 21 true no-hitters thrown since 2017.
(It does look better compared with the five previous losing ‘no-hitters’ that have been thrown throughout history…we’ll get to those.)
By Game Score, the best no-hitter thrown in recent seasons came from the arm of Justin Verlander on Sept. 1, 2019. When Verlander no-hit the Toronto Blue Jays, he did so on a Game Score of 100.
Three other pitchers achieved Game Scores of 97 or higher in tossing their no-hitters. John Means (Baltimore, May 5, 2021 vs Seattle) and Lucas Giolito (White Sox, Aug. 25, 2020) against Pittsburgh) both reached 99. When Joe Musgrove threw his no-hitter for San Diego against Texas on April 9, 2021, it scored at 97.
What about Sunday? In working into the eighth inning of his losing effort, Greene – the Cincinnati Reds’ starter – only hit 78 on the Game Score scale.
Even were we to count it as a ‘no-hitter’, that would rank only 17th in quality by Game Score among the no-hitters thrown since 2017.
Win Probability Added makes the Greene-Warren effort look even less superb. On that scale, the Reds pitchers’ performance rated .212. Only the combined no-hitter produced by the Angels’ Taylor Cole and Felix Pena against Seattle on July 12, 2019 yielded a smaller Win Probability Added, .086.
And in fairness to Cole and Pena, WPA is somewhat score-dependent. The Angels scored 14 runs in their no-hitter, accounting for the low impact on victory attributed to the no-hit pitchers.
Here are the five best no-hitters since 2017 as measured by the pitcher’s WPA. It happens that all five were one-pitcher no-hitters.
1. Justin Verlander, Houston vs Toronto, Sept. 1, 2019, .666
2. Corey Kluber, New York Yankees vs. Texas, May 19, 2021, .627
3. Mike Fiers, Oakland vs. Cincinnati, May 7, 2019, .622
4. Wade Miley, Cincinnati vs. Cleveland, May 7, 2021, .607
5. Edinson Volquez, Miami vs. Arizona, June 3, 2017, .593
Measured only by the standards of losing ‘no-hittters,’ the Greene-Warren effort does look somewhat better. Theirs was the sixth such game in history. Here are the Game Scores and Win Probability Added calculations for the pitchers or staffs in all six. They are listed in order of Win Probability Added. Where more than one pitcher was used, the reliever is indicated in parenthesis.)
Pitcher(s) Team/Opp. Date Game Score WPA
Jered Weaver LAA/LA 6-28-08 73 .238
(Jose Arredondo)
Hunter Greene Cin/Pit 5-15-22 78 .212
(Art Warren)
Ken Johnson Hou/Cin 4-23-64 92 .181
Steve Barber Bal/Det 4-30-67 71 .133
(Stu Miller)
Matt Young Bos/Cle 4-12-92 73 .117
Andy Hawkins NYY/CWS 7-1-90 72 .049
So Greene-Hunter rank second among losers for ‘no-hitter’ performance, behind Johnson in Game Score and behind Weaver in WPA. But their effort Sunday pales by comparison with actual no-hitters of recent vintage.
