Which MLB players make up the 2023 All-Availability Team?

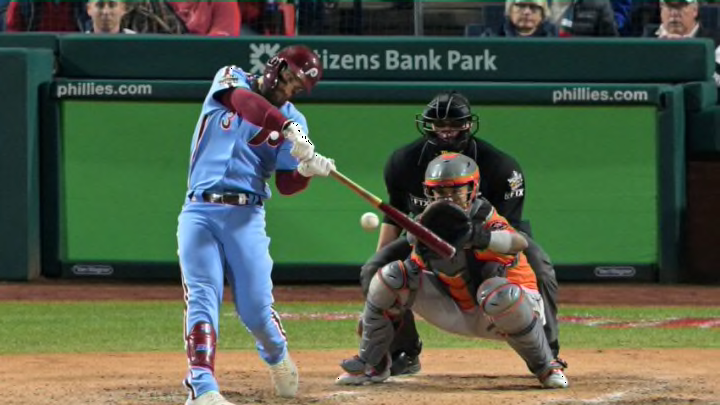
Nov 3, 2022; Philadelphia, Pennsylvania, USA; Philadelphia Phillies designated hitter Bryce Harper (3) hits a double against the Houston Astros during the fifth inning in game five of the 2022 World Series at Citizens Bank Park. Mandatory Credit: John Geliebter-USA TODAY Sports
8 of 11
Next

The best ability, the saying goes, is availability. That’s certainly true in baseball, where the MLB player’s value is directly related to the time he spends on the field.

Case studies establishing the importance of availability are so common they hardly need to be mentioned. But just for the record:

  • Fernando Tatis Jr. never took the field in 2022. His Win Probability Added, obviously, was zero.
  • Jacob deGrom logged just 64 innings in 11 starts. For his Mets, that worked out to a 0.8 WPA.
  • Bryce Harper missed 63 games with an injury. His 2.2 WPA was less than half his total from one season previously.
  • Kris Bryant, a former MVP signed by Colorado for seven seasons at $184 million, missed 120 games and valued out at -0.7 WPA in 2022.
  • Mike Trout had his playing time limited by injuries for the second consecutive season. Since finishing fifth in MVP voting in 2020, Trout has generated just 5.6 total WPA for the Angels. That was his annual average between 2012 and 2017.

Availability is one of the most important yet least talked-about aspects of talent assessment. Which MLB players can a team count on to take the field year-after-year?

This is a fresh look at player value reassessed through the prism of availability. For each position, players are assessed based on two common SABRmetric factors: WAR and OPS+. But here’s the catch: Players are only assessed if they made a minimum of 500 plate appearances in each of the last two seasons: That’s the availability part.

A total of 85 position players met that availability criteria in both 2021 and 2022. The player who set the standard for availability with a total of 1,448 plate appearances was Marcus Semien.

That 1,448 figure gives us our third ranking criteria: percentage of plate appearances against the 1,448 standard.

Position-by-position, here are the game’s most valuable players when availability is factored in.

Phillies catcher J.T. Realmuto. Bill Streicher-USA TODAY Sports
Phillies catcher J.T. Realmuto. Bill Streicher-USA TODAY Sports /

Catcher

Catcher is a physically demanding position, and the use of catching tandems is common in MLB today. Only a handful of teams even allow their principal catcher to accumulate 500 plate appearances in a season.

So it’s not surprising that only two catchers — the fewest of any position — reached the 500 plate appearance per season threshold for availability to be considered.

Those two were J.T. Realmuto of the Phillies and Will Smith of the Dodgers. Realmuto had the better WAR, with 3.5 in 2021 and 6.5 in 2022, for a total of 10.0. Smith measured 3.5 and 4.2, for 7.7

But Smith had the superior OPS+, scoring 127 and 120 for a two-year average of 123.5 Realmuto produced OPS+ ratings of 110 and 129 for an average of 119.5.

That narrowed the question to total plate appearances. Realmuto came to bat 1,099 times in those two seasons, amounting to 75.9 percent of the 1,448 standard set by Semien. Smith fell just short of that, with 1,079 plate appearances or 74.5 percent of Semien’s standard.

Based on ordinal ranks in all three categories, Realmuto earned first team all-availability with an average rank of 1.33. Smith’s first-, second- and second-place finishes put him on the second team at an average rank of 1.67.

Pete Alonso. John Jones-USA TODAY Sports
Pete Alonso. John Jones-USA TODAY Sports /

First base

In stark contrast with the catching position, 15 players whose primary position was first base reached the 500 plate appearance plateau in both 2021 and 2022. That’s the most at any position.

First base is also one of the game’s glamour positions, so the talent list is impressive. Freddie Freeman and Vlad Guerrero Jr., qualify, as do Jose Abreu, Paul Goldschmidt, Pete Alonso and Anthony Rizzo.

Among the 15, Goldschmidt had the highest cumulative WAR, at 6.1+7.8 = 13.9. Guerrero ranked second (6.8 +3.9 = 10.7) and Freeman third (4.7 +5.9 = 10.6.)

Matt Olson and Alonso were fourth and fifth.

Goldschmidt also had the highest average OPS+ at 160.5. Guerrero (149.5), Freeman (144.0), Alonso (139.5) and Olson (137.5) trailed.

But the deciding factor at first base turned out to be availability. With 1,404 plate appearances — 97.8 percent of Semien’s standard — Guerrero ranked first in the category, ahead of Freeman, Olson and Abreu.

Goldschmidt, who led both of the first two categories, ranked only fifth with 1,330 plate appearances.

That gave first team honors to Guerrero, with an average ordinal rank of 1.67 based on his seconds in WAR and OPS+ and his leadership in plate appearances.

Goldschmidt (first, fifth and fifth for an ordinal average of 2.33) made second team all-availability. Freeman (2.67) was third, Olson fourth and Alonso fifth.

Marcus Semien. Jerome Miron-USA TODAY Sports
Marcus Semien. Jerome Miron-USA TODAY Sports /

Second base

Six second baseman hit the 500 plate appearance mark in  both 2021 and 2022 required to qualify for consideration. Those six were Semien, Jose Altuve, Jake Cronenworth, Tommy Edman, Adam Frazier and Cesar Hernandez.

Since WAR is a counting stat, Semien’s leadership in availability gave him an advantage, and he used it. His cumulative 13.2 WAR for the two-season period ranked well ahead of his competitors. Edman (10.1) was second and Altuve (9.5) third.

At an average of 143.5, Altuve was the runaway leader in OPS+. Semien was a distant second at 119.5 followed by Cronenworth (116.5).

As the MLB leader, Semien obviously also lead the field in availability with his 1,448 plate appearances, representing 100.0% of the theoretical max. The battle for second was a close one, Cronenworth (1,327) edging out Edman (1,321) by six trips.

Not surprisingly, then, Semien emerged as the overall position first-teamer, with an average ordinal score of 1.33 based on his ranks of first, second and first.

Second-team honors at second base went to Altuve (third, first and fourth for an ordinal average of 2.67.) Cronenworth and Edman (both averaging 3.00) tied for third, with Frazier (5.33) and Hernandez (5.67) bringing up the positional rear.

Bo Bichette (foreground). Dan Hamilton-USA TODAY Sports
Bo Bichette (foreground). Dan Hamilton-USA TODAY Sports /

Shortstop

Fourteen shortstops qualified for consideration, but the talent disparity was substantial. A solid upper class emerged with four shortstops amassing WARs exceeding 4.0 in both seasons.

Cumulatively, the WAR leader was well-traveled free agent Carlos Correa. He accumulated 7.2 WAR for the 2021 Astros, then added 5.4 WAR for the 2022 Twins, giving him a total of 12.6.  Trea Turner was a close second with 6.5 for the 2021 Nats and Dodgers plus 4.9 in 2022, a total of 11.4 Xander Bogaerts and Bo Bichette were third and fourth respectively.

Correa also led in OPS+ with a two-season average of 135.5. That barely beat out Turner’s average of 133, with Bogaerts and Bichette again third and fourth.

But as was the case at second base, availability turned out to be the decisive element of the equation. Bichette led in that category with 1,387 plate appearances, 95.8 percent of the theoretical max set by Semien. Turner, at 1,354 (93.5%) was second, with Dansby Swanson and J.P. Crawford in the third and fourth positions.

Bogaerts, with 1,234, ranked only sixth, and that was one spot ahead of Correa, who tied Francisco Lindor for seventh with 1,230.

The ordinal results elevated Turner into first place with runner-up standings in all three categories, creating a 2.00 average. Correa fell into a tie for second team all-availability with Bichette, both at an  ordinal average of 3.00.

Bogaerts (4.00) was fourth, Swanson (5.67) fifth and Lindor (6.00) sixth.

Rafael Devers. Tommy Gilligan-USA TODAY Sports
Rafael Devers. Tommy Gilligan-USA TODAY Sports /

Third base

Eleven third basemen met the standard of 500 plate appearances in both seasons, and those 11 included some of the game’s front rank stars. Rafael Devers was in the group as were Nolan Arenado, Austin Riley, Jose Ramirez and Manny Machado.

The WAR category was nip-and-tuck, going to Ramirez by the smallest of margins. With WARS of 6.7 and 6.0, he totaled 12.7 for the two seasons, edging out Riley (6.1+6.5=12.6) by a tenth of a point.

Arenado finished third in WAR, ahead of Machado and Devers.

OPS+ proved to be even closer. Both Machado and Ramirez averaged 145 for those two seasons, tying for first. Riley, at 138.5, stood third, barely ahead of Devers and Arenado.

Riley also led in availability, piling up 1,355 plate appearances, or 93.6 percent of Semien’s theoretical maximum. Ramirez accumulated 1,321, but that was only good for second best, with Machado third, Devers fourth and Arenado fifth.

Reduced to ordinal ranks, the final verdict went to Ramirez based on his finishes of first, first and second for an average placing of 1.33. Riley, with finishes of second, third and first for an average of 2.00, was second, with Machado, Devers and Arenado trailing in that order.

Rays left fielder Randy Arozarena. Nathan Ray Seebeck-USA TODAY Sports
Rays left fielder Randy Arozarena. Nathan Ray Seebeck-USA TODAY Sports /

Left field

Only seven left fielders qualified with 500 plate appearances in both 2021 and 2022, the seven being Randy Arozarena of Tampa Bay, Andrew Benintendi of Kansas City and the Yankees, Mark Canha of Oakland and the Mets, Ian Happ of the Cubs, Austin Hays of Baltimore, Tommy Pham of San Diego, Cincinnati and Boston and Alex Verdugo of Boston.

The category turned out to be one of the most lopsided, Arozarena winning all three categories.

The Tampa Bay star led in WAR with a two-season cumulative of 9.69. That was nearly a full point ahead of Happ, the runner-up. Benintendi was third, then Hays.

Posting a 2022 OPS+ of 124 atop his 141 of 2021, Arozarena averaged 126.5, comfortably ahead of Happ’s 119 average. Benintendi and Canha tied for third at 116.5.

Arozarena also led in availability, seeing 1,249 plate appearances. That represented 86.3 percent of Semien’s theoretical maximum, and barely ahead of runner-up Verdugo, who had 1,248. Pham was third this time, with Happ fourth and Canha fifth.

Arozarena became one of only two players to lead all three of the ordinal categories, his 1.00 average being impossible to beat. For the record, Happ earned second-team all-availability with finishes of second, second and fourth for a 2.67 ordinal average. Benintendi and Canha, both at 4.33 tied for third.

Cedric Mullins. David Richard-USA TODAY Sports
Cedric Mullins. David Richard-USA TODAY Sports /

Center field

Again, the constant churn of turnover in center field made the competition sparse. Only five center fielders reached the 500 plate appearance standard both seasons to be considered.

Fortunately for the quality of the position, one of the five was Aaron Judge, the record-setting American League home run champion. His four competitors were Trent Grisham of the Padres, Cedric Mullins of the Orioles, Brian Reynolds of the Pirates and Myles Straw of the Astros and Indians.

Obviously Judge emerged as the overall winner, and with good statistical reason. With a total of 16.6 cumulative WAR, he was nearly twice as valuable by that standard as Mullins, the category runner-up at 9.5. Reynolds, at 8.9 WAR, was third, followed by Grisham and Straw, both at 5.9

Judge’s 2021 OPS+ of 148 and his 2022 score of 211 created a 180.0 average, again comfortably ahead of the field. Reynolds, at 135.5, was second, with Mullins, Grisham and Straw trailing in that order.

But unlike Arozarena in left field, Judge did not complete the category sweep. His total of 1,329 plate appearances, 91.8 percent of the theoretical max, only ranked second. Mullins was the category leader at 1,347. Reynolds, Straw and Grisham trailed.

That still left Judge with a solid overall advantage amounting to 1.33 ordinal average. With category finishes of second, third and first, Mullins was second at 2.00. Reynolds, at 2.67, was third.
Juan Soto. Jayne Kamin-Oncea-USA TODAY Sports
Juan Soto. Jayne Kamin-Oncea-USA TODAY Sports /

Right field

Ten players qualified while predominantly playing right field. As with Arozarena in left, this position was dominated by one clearly superior player.

Juan Soto was the easy WAR leader with scores of 7.1 in Washington in 2021 followed by 5.6 in Washington and San Diego in 2022. That totaled 12.7 and was nearly two points more than Houston’s Kyle Tucker (10.9) in second place. Mookie Betts (10.6) was third. Starling Marte ranked fourth in the category and Texas’ Adolis Garcia fifth.

Tucker posted a 128 OPS+ in 2022 atop his 147 of 2021 for an average of 137.5. But that was a figurative mile behind Soto, with scores of 175 and 149 for an average of 162.0. Marte (132.0) was third, Betts (131.0) fourth and Teoscar Hernandez (120.0) fifth.

Soto completed his sweep of the category with a plate appearance total of 1,321. That was 91 percent of the theoretical maximum availability. It left the rest of the field to vie for second-team status. Garcia was second in availability with Betts, Tucker and Nick Castellanos third through fifth.

The final result: Soto at 1.00 with a clean sweep of the categories, followed by Tucker (2.67), Betts (3.33), and Garcia (5.00).

The startling thing here is the relatively modest third place showing of Betts. He trailed Soto in both WAR and OPS+. But his moderate availability, 82.1 percent of the two-season theoretical maximum, was what really undermined any chance of him overtaking Soto and winning the category.

Shohei Ohtani. Stan Szeto-USA TODAY Sports
Shohei Ohtani. Stan Szeto-USA TODAY Sports /

Designated hitter

For a position with no defensive component whatsoever, it may be surprising that only four DHs reached the 500 plate appearance minimum both seasons to be considered. The four were Yordan Alvarez of Houston, Nelson Cruz of Minnesota, Tampa Bay and Washington, J.D. Martinez of Boston and Shohei Ohtani of the Angels.

Here, of course, we are only counting player data for the offensive side of the game, so Ohtani’s substantial pitching contributions are not figured in to his rating.

Alvarez wins in WAR with a cumulative score of 9.8. That’s 1.5 better than Ohtani, his only serious challenger. Martinez (4.1) is third and Cruz (2.7) fourth.

Alvarez also leads the group in OPS+ with an average of 161.5. Again, Ohtani is a comfortable second at 151.0, well ahead of Martinez (122.5) and Cruz (109.5).

Where Ohtani emerges as a contender is in availability. He totaled 1,305 plate appearances during the two seasons, 90.1 percent of the theoretical maximum and significantly more than Alvarez (1,159). In fact Martinez (at 1,230) also bettered Alvarez in availability.

That created a tie for the overall positional leadership. Both Ohtani (second, second, first) and Alvarez (first, first, third) had average ordinal scores of 1.67. Martinez was third and Cruz fourth.

Yandy Diaz. Dan Hamilton-USA TODAY Sports
Yandy Diaz. Dan Hamilton-USA TODAY Sports /

Utility

Eleven players qualified for consideration despite changing their primary positions between 2021 and 2022. There was no pattern to the moves: Max Muncy from first to third base, Whit Merrifield from second base to right field, Gleyber Torres from shortstop to second, and Yandy Diaz from first to third are examples of the variety of movement.

Of the 11, Muncy was the easy leader in WAR with a total of 7.6. The category runner-up, DJ LeMahieu, totaled 5.3, with Diaz a close third at 5.1

Diaz was the front-runner in average OPS+ at 126.5, and nobody else was particularly close. Muncy averaged 115.5 to rank second, with LeMahieu (104) third, and Torres and Trey Mancini (103.5) tying for fourth.

Availability favored Merrifield, who logged 1,270 plate appearances over the two seasons. That represented 87.7 percent of the theoretical maximum. LeMahieu was second, Mancini third and Jonathan Schoop fourth.

As you can tell from the above, the utility position is a diverse category with no standout. It’s probably appropriate, then, that as at DH a deadlock in the ordinal ranks emerged for the top spot.

Next. Which 6 MLB teams could surprise in 2023?. dark

Both Muncy (first, second, sixth) and LeMahieu (third, fourth, second) averaged 3.00 for the positional lead. Diaz was a fairly close third at 3.67, with Merrifield (5.33) and Mancini (5.67) fourth and fifth.

Next