

Top 10 MLB Statcast hitters by traditional metrics
We’re looking at the top 10 Statcast hitters in Brls/PA to see how that correlates with other metrics. Are these the 10 best hitters in the game?
We’re about a third of the way through the 2018 season. That’s a good point to look back and reflect on some numbers. We are in a golden age of information in the sport of baseball. So let’s break down some Statcast hitters!
These new metrics purportedly do a better job of predicting future success than things like batting average or RBI totals. They may also be more predictive than more advanced stats like wRC+ or wOBA.
In fact, Statcast data at Baseball Savant includes expected versions of some stats, usually denoted with an “x” before a more recognizable stat. So you may see xwOBA instead of wOBA. xwOBA is what you would predict a player’s wOBA would be based on their launch angles and exit velocities.
Each property has its own hit expectancy, but combining the factors leads to a greater level of accuracy. So we’ll be taking a look at the top ten hitters by Brls/PA (a measure of high-quality contact) and checking them against AVG, OBP, SLG, HR, RBI, wRC+, wOBA and xwOBA.
This gives us a wide range of metrics to measure them against. And it should provide us with an interesting look at the correlation between that high-quality contact and the various results that can follow. These stats are accurate as of Saturday morning, May 26, 2018.
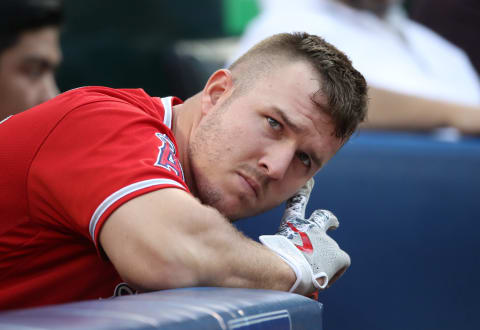
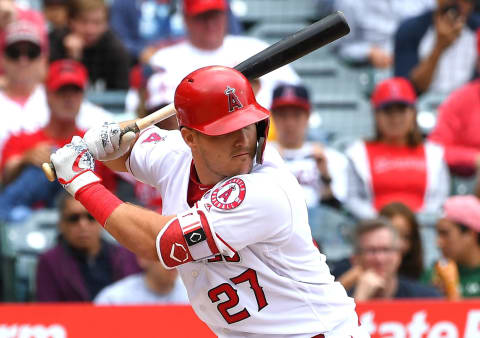
10. Statcast: Mike Trout, OF – Los Angeles Angels (10.2 Brls/PA)
- AVG – .293 (36th)
- OBP – .449 (1st)
- SLG – .644 (3rd)
- HR – 16 (2nd)
- RBI – 30 (32nd)
- wRC+ – 195 (2nd)
- wOBA – .454 (2nd)
- xwOBA – .467 (2nd)
The perennial MVP candidate is off to another great season. He comes in at 10th on this list, but his results are mostly in the top 3. The exceptions are AVG and RBIs. Batting average is highly variable from year to year and RBIs are a function of opportunity.
Looking at Mike Trout’s splits, we can see that all of his 51 games have been played with him hitting in the top three of the lineup. Of those 51, 48 have been hitting 2nd.
This is likely due to the studies that have been done which suggest the 2nd hitter should be a high OBP hitter, and one of the best on the team. Trout leads MLB in OBP and has plenty of power. We can see that in his 3rd best SLG and 16 home runs, good for a tie at 2nd in baseball.
This makes sense since over the course of the entire game (or the entire season) a 2-hole hitter will see similar opportunities to a 3rd hitter, but more often. So according to the “new book” you want that guy to be better than your 3rd hitter.
The argument for moving him lower in the order.
Traditionally you’d want your best hitter for average at 3 and your best power bats at 4 and 5. Trout is the team’s best hitter for OBP and power, and if he had been hitting 4th, he would likely have more RBIs. And you could justify moving Trout to 4th given that the “new book” does consider this spot in the lineup to be equally as important as 2nd.
Regardless, Trout is in the discussion for best hitter in the game whether we are looking at older metrics or the new stuff. Interestingly, despite his incredibly high ranking 3rd or higher in 6 out of the eight metrics we are looking at, he comes in at 10th in Brls/PA. We’ll try to figure out why as we move through this list.
9. Statcast: Xander Bogaerts, SS – Boston Red Sox (10.2 Brls/PA)
- AVG – .285 (DNQ)
- OBP – .327 (DNQ)
- SLG – .533 (DNQ)
- HR – 7 (DNQ)
- RBI – 26 (DNQ)
- wRC+ – 128 (DNQ)
- wOBA – .366 (DNQ)
- xwOBA – .396 (40th)
Xander Bogaerts doesn’t qualify for the stats tracked through Fangraphs.com because he spent some time on the DL early in the year. That said, his stats compare very favorably to the hitters around him in this top 10. He’d slot in at 7th in AVG, OBP, and SLG among these 10 players, and 8th or worse in HR and RBI.
Bogaerts has been hitting the ball very hard this season and is on track to have a career-highs across the board as a hitter. He has the 19th best average exit velocity at 92.1 MPH and the 34th longest average HR distance at 407 feet.
He’s crushing the ball in the way that Red Sox fans were envisioning as he came up through the minors up through the 2013 season. That year he hit 15 HR in 116 minor league games. A 21 HR pace over a full season.
What’s in store for him in the future?
That happens to be his high mark thus far, reaching it in 2016 over 157 games. Should he continue hitting home runs at the pace he has currently set, he would finish the year with 22 in 108 games. That’s a 33 HR pace over a full season.
With no indications that he’s outperforming his quality of contact, this is a great time to be a Xander Bogaerts backer. He’s breaking out in a big way. Don’t be surprised to see him showing up on the back end of MVP ballots come October, or for years to come!
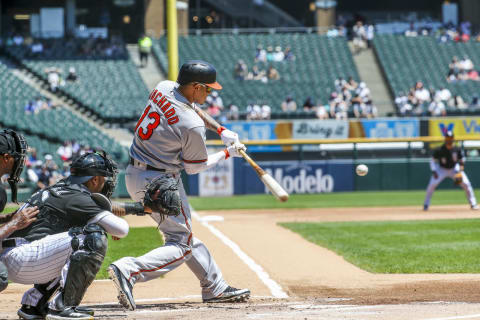
8. Statcast: Manny Machado, SS – Baltimore Orioles (10.3 Brls/PA)
- AVG – .328 (8th)
- OBP – .402 (11th)
- SLG – .621 (4th)
- HR – 15 (4th)
- RBI – 44 (1st)
- wRC+ – 170 (5th)
- wOBA – .423 (4th)
- xwOBA – .410 (22nd)
It’s a contract year for Manny Machado, so it’s not a shock to see him having his best year ever. Players do this all the time. A massive contract is a great motivator. As far as counting stats go, Machado has been one of the most consistent hitters in baseball. You can usually pencil him in for at least 30 HR and something around 90 RBIs.
Once again we are seeing a hitter who scores higher than his ranking in Brls/PA in most of these categories. Machado is 4th or better in MLB in 5 of the eight metrics. So why is he only 8th here?
Well, that xwOBA gives us a clue. It’s lower than his wOBA at .410. That puts him 7th, ahead of just three hitters from this group of 10; Joey Gallo, Xander Bogaerts, and A.J. Pollock. So it makes sense that his Brls/PA come in at a similar rank of 8th. After all, both are derived from a combination of exit velocity and launch angle.
There’s more good news!
Interestingly, a jump to 16.9 degrees for average launch angle coincides with a career-high average EV of 93 MPH. Usually, we would see average EV go up as launch angle comes down since you are more likely to square up the ball when swinging at a similar plane to how the pitch comes in. That’s the 0-10 degree range, which doesn’t produce a lot of fly balls.
So he’s hitting the ball harder, but also putting it in the air more often. That’s a very good combination if we are looking for signs of sustainability. Hitters mostly want to keep their launch angles in the 15-25 degree range to maximize their production.
Having an average EV within that range is a fantastic sign. If recency bias has anything to say about it, Manny Machado is setting himself up for an absolutely staggering free agent contract.
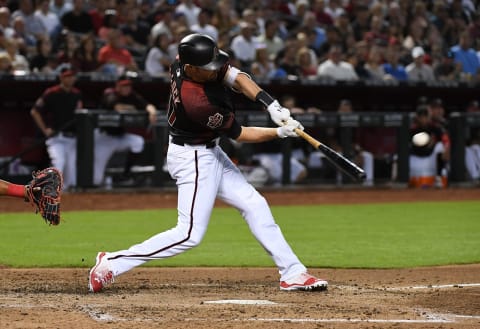
7. Statcast: A.J. Pollock, OF – Arizona Diamondbacks (10.8 Brls/PA)
- AVG – .293 (35th)
- OBP – .349 (68th)
- SLG – .620 (5th)
- HR – 11 (17th)
- RBI – 33 (21st)
- wRC+ – 158 (10th)
- wOBA – .403 (11th)
- xwOBA – .404 (33rd)
Unfortunately, due to a fractured thumb, A.J. Pollock is currently out for a 4-8 week DL stint. That takes the wind out of his sails as well as his team’s, the Arizona Diamondbacks. Both were off to a great start when the injury occurred.
He was on pace for easily his best season to date with a 10th best in baseball wRC+ and his best start for power ever. Since his speed hadn’t appeared to decline at all, he was maybe going to put himself in serious MVP contention for the first time.
Pollock is an interesting case here. His xwOBA and wOBA are at odds with the former being 33rd best but the latter at 11th. Of course, the difference between the two is just .001. That means he’s essentially what we’ve seen so far and regression was unlikely.
The good news is that his injury was a thumb fracture and not a tear. A fracture is less likely to impact his power when he returns than a ligament tear. So he may get back on the field and pick up where he left off.
Something worth looking at…
One thing that stands out with A.J. Pollock is that his strikeout rate has jumped up to 22.9% from his 2017 rate of 15.2%. That’s accompanied by a swinging strike rate of 10.2%, up from 6.9% in 2017.
So he’s selling out for power a bit, which we can see in his launch angle being up almost 6 degrees. It’s not showing up in his batting average, however, which is a significant improvement over last season’s .266.
All told, Pollock appears to have found a great balance between driving the ball with authority in the air and still making contact at a high rate. Despite the jump, his swinging strike rate is still in the top 100 in baseball. Not elite, but plenty good enough to keep him in the mix for MVP votes in a healthy season.
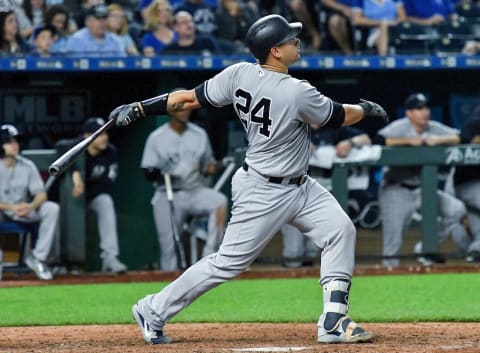
6. Statcast: Gary Sanchez, C – New York Yankees (11.3 Brls/PA)
- AVG – .230 (133rd)
- OBP – .333 (81st)
- SLG – .539 (18th)
- HR – 12 (13th)
- RBI – 33 (23rd)
- wRC+ – 134 (36th)
- wOBA – .371 (35th)
- xwOBA – .411 (21st)
Gary Sanchez was always expected to hit. The big question with him as he came up through the New York Yankees farm system was whether he’d be able to stay behind the plate. Those questions are still being asked.
But Yankees fans can take solace in the fact that his bat is everything they could have hoped for. And probably more. He’s probably the biggest overachiever on this list, coming in no better than 13th in any one metric. But that could be an indication that he’s due for regression in a positive direction. Yeah, it’s possible he’s going to see even better results going forward. Sorry Red Sox fans.
He has hit mostly 5th in the lineup so far, which should provide him with plenty of RBI opportunities. Or, at least, it would in a normal lineup. Unfortunately for him (but fortunately for the Yankees) he’s hitting behind Aaron Judge, Giancarlo Stanton, and Didi Gregorius. That strips him of runners on base more than we’d see in virtually any other lineup. It’s a tradeoff I’m sure most Yankees fans are happy to make.
It’s not all improvements, though…
The areas of concern with Gazy Sanchez are his AVG and OBP. Both are significantly lower than his previous two season totals. That could be due to his .228 BABIP which is due for positive regression.
It might also be a trade-off from increasing his launch angle to a career-high 15.8 degrees. That’s an increase of 2.6 degrees from last year and 7.9 from 2016. He’s trying to lift the ball more, and that’s going to bring up his swinging strike rate. Well, usually.
His 11.5% swinging strike rate is one percent lower than his 2017 total and 1.5% below where he finished 2016. That means the trade off is showing up somewhere else. In this case, it’s his line drive rate which dropped from 21.1% to 15.0%.
That means fewer balls hit hard in the 10-19 degree range, which is the second most productive in all of baseball. Fortunately for him, he ranks 11th in balls put into play between 19 and 26 degrees, which is the most productive range.
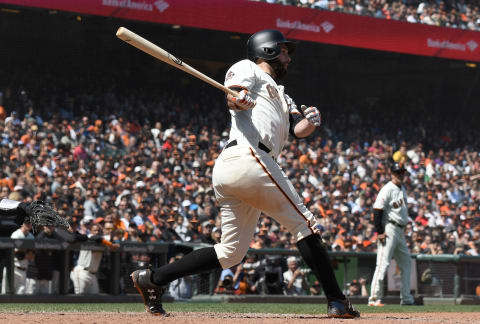
5. Statcast: Brandon Belt, 1B – San Francisco Giants (12.4 Brls/PA)
- AVG – .316 (16th)
- OBP – .413 (7th)
- SLG – .585 (7th)
- HR – 11 (16th)
- RBI – 29 (40th)
- wRC+ – 175 (3rd)
- wOBA – .422 (5th)
- xwOBA – .441 (7th)
Brandon Belt has always been a good hitter. In fact, he’s a better hitter than most give him credit for. His lowest wRC+ since becoming a full time regular in 2012 is 115, and in three of those six years, he’s bested 132.
If he keeps up the pace, he will make that four out of seven with this being seen as a “breakout” performance. While he’s always hit for a little power, it’s never been quite as much as you’d expect from a first baseman.
He’s hit between 17 and 18 home runs in four different seasons and never reached 20 in a single campaign. This season he already has 11 which puts him on pace for 35 over 149 games. While it may be a little silly to say that a hitter who has had three seasons between a 132 and a 140 wRC+ is breaking out, that’s exactly what he appears to be doing.
Brandon Belt has taken a step forward.
This isn’t the first time he’s ranked highly in OBP. In 2016 he finished the year with the 9th best OBP in baseball. It would be the first time he finished in the top 10 in SLG however. The reason for his massive increase in Brls is a bit tough to see.
His average EV and launch angles aren’t much different from his 2017 season. He’s striking out a touch more and walking a bit less, so perhaps he’s more aggressive?
We can see some significant differences are his batted ball profile. Brandon Belt is pulling the ball almost 3% more often than he was in 2017 and has gone to the opposite field 8% more often. That’s a significant drop in balls up the middle where he has a .358 career average and a 148 wRC+. Wait, what?
Despite the solid results on balls up the middle, he’s much better when pulling the ball, sporting a 226 wRC+ for his career. That includes a .785 SLG and 69 of his 109 HR. The reason he’s hitting for so much more power this season is that he’s pulling the ball more often.
In fact, 9 of his 11 HR have been to the pull side. Additionally, 20 of his 33 line drives have been pulled, and only 1 of his eight bloop singles have gone to the pull side. Of the remaining 7, six have ended up in shallow left field.
It seems like Brandon Belt has realized that he’s at his best when pulling the ball, and the best way to do that is to get in the zone early with the bat. Said differently, be more aggressive.
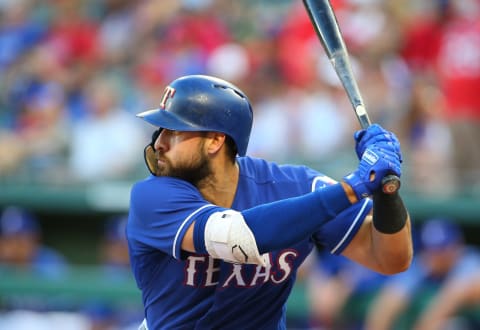
4. Statcast: Joey Gallo, 1B/OF – Texas Rangers (12.9 Brls/PA)
- AVG – .195 (156th)
- OBP – .271 (153rd)
- SLG – .453 (67th)
- HR – 14 (8th)
- RBI – 31 (30th)
- wRC+ – 88 (131st)
- wOBA – .308 (119th)
- xwOBA – .373 (75th)
This is the first oddity on the list. Joey Gallo hits the ball extremely hard. I don’t think anyone is going to find that to be a surprising statement. He may have the best raw power in all of baseball. But if he’s barreling the ball so often, why does he rank so low in most of these metrics? Well, the answer is that he’s a three true outcomes hitter. And not just any three true outcomes hitter. He’s on pace to be the most prolific one of all time.
In short, he hits a lot of home runs, takes a lot of walks, strikes out a bunch and doesn’t do much else. Around 60% of his plate appearances end in one of those three outcomes. And when he does put the ball into play without hitting a home run, he’s not exactly lighting up the launch angle ranges you want to see.
Time for some messy numbers.
While Joey Gallo has the fourth highest rate of balls hit in the 19 to 26-degree range (the most productive), he ranks 243rd for the number of balls hit 0 and 10 degrees. That means very few ground balls which are, typically, the hardest hit balls in play. He’s also 239th in balls hit between 10 and 19 degrees. That’s two very low rankings in two very high production launch angle ranges.
On the other hand, he’s 78th for balls hit in the 26 to 39-degree range, which is only the fourth most productive of the ranges tracked at xStats.org. On top of that, he has the 27th highest popup rate (balls greater than 39 degrees) in baseball this year.
That’s a lot of medium to low-quality contact. But again, he’s a three true outcomes hitter, so his numbers are always going to look a little weird.
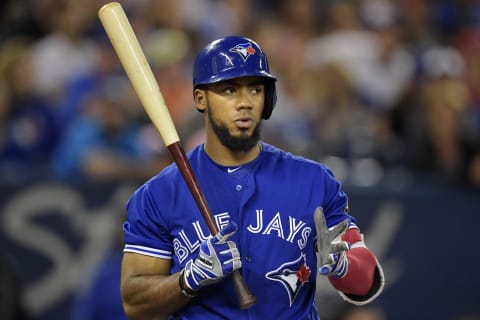
3. Statcast: Teoscar Hernandez, OF – Toronto Blue Jays (13.6 Brls/PA)
- AVG – .253 (97th)
- OBP – .302 (127th)
- SLG – .500 (42nd)
- HR – 7 (68th)
- RBI – 20 (101st)
- wRC+ – 114 (85th)
- wOBA – .341 (77th)
- xwOBA – .420 (16th)
This is another interesting name on the list. His results don’t match up with his ranking here, which might suggest a positive regression is coming. A .290 BABIP might throw so cold water on that hot take, though. His xwOBA of .420 does suggest underperformance relative to the quality of his contact.
While you would expect this to show up in his BABIP, the relatively high rate of balls hit in the 0 to 10-degree range (115th in baseball) and ranking 246th in balls hit between 26 and 39 degrees leaves him with a narrow range of balls in play with which to succeed.
Just 30.7% of his balls in play fall within the 19 to 39-degree range, which is virtually all of those Barrels will come from. The harder the ball is hit, the wider the range of launch angles you will see Barrels occur in.
Let’s check with an expert.
As Mike Petriello described in the link from the second paragraph:
“As you can see, the “Barrel Zone” is an area that begins at 98 mph between 26 degrees and 30 degrees, and expands outward from there. The higher the speed of the ball, the wider the range of launch angle exists for a ball to be considered a barrel. At 99 mph and up, for example, between 25 degrees and 31 degrees is “barrelled.” At 100 mph and above, batted balls between 24 and 33 degrees will always be considered a barrel, and so on, expanding as balls get hit harder.”
His max EV is 112.2 MPH, and his average is 92.1. That means he’s likely got a slightly larger barrel zone than most hitters. Even still, it’s unlikely he’s seen many Barrels outside of the 25-30 degree range. His number of balls hit in that range is extremely small. It’s probably somewhere between 6 and eight balls in play.
That doesn’t line up with what’s described above.
Baseball Savant has him listed with 22 Barrels, though, so where are they coming from? While we don’t have the ability to break down every hit by launch angle, we can take a guess.
Chances are he’s putting the ball into play at exit velocities greater than 100 MPH. This would mean that a significant portion of the balls hit in that 19 to 26-degree range, mostly the upper half of them, would qualify as Barrels.
Having a high number of balls in play in that range is usually part of a much more complete quality contact profile. But Hernandez sits relatively low in the ranges just above and just below that, which likely means he’s making two kinds of contact.
Hard drives on the low end of the fly ball spectrum, and mediocre to poor contact. That’s a recipe for throwing a metric like Brls/PA off a bit. And that’s not to say that Teoscar Hernandez hasn’t been a good hitter. It’s just that he’s not in the caliber of most of the rest of this list.
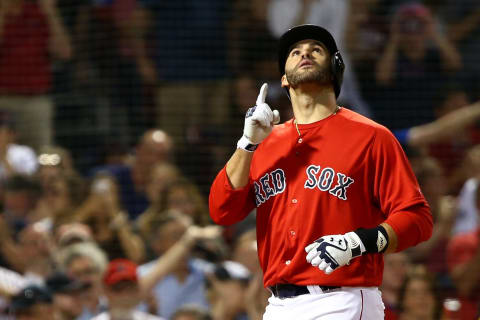
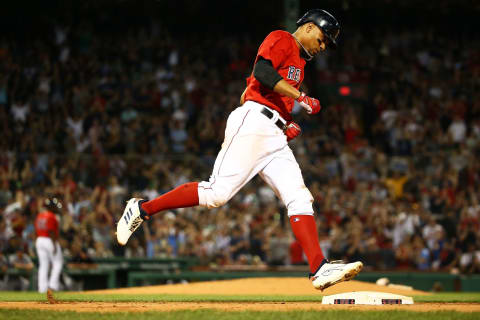
2. Statcast: J.D. Martinez, OF/DH – Boston Red Sox (14.3 Brls/PA)
- AVG – .326 (9th)
- OBP – .381 (26th)
- SLG – .653 (3rd)
- HR – 16 (2nd)
- RBI – 42 (2nd)
- wRC+ – 173 (4th)
- wOBA – .432 (3rd)
- xwOBA – .454 (4th)
Now we come to the part of the list that Red Sox fans have been waiting for. The next two hitters both play for the Carmine Hoses, and they have been, arguably, the best two hitters in the game. The first is J.D. Martinez. With seven of the eight categories being top 10 in baseball, and six of those seven being 4th or better, the former Tigers slugger is earning every bit of his big contract.
The one area in which he is not showing up at the top of the league is OBP. But since his breakout in 2014, his OPS has been driven by is SLG, so that’s not surprising. His .381 is pretty similar to what he’s done in the last two seasons, so don’t expect to see it rise much.
That said, he has continued his torrid home run pace from 2017, which is something even I didn’t think he had in him. He’s currently on pace for 56 in 153 games. Mea culpa, I guess!
Is it more of the same or is he doing anything different?
His strikeout and walk rates are in normal ranges for him, though his opposite field rate has gone up from 28.9% in 2017 to 36.7% this season. That’s kind of remarkable considering how hard it is to hit home runs to center and right field in Fenway Park.
If anything, the assumption was that playing in Fenway would dampen the home run rate a bit. Somehow he’s increased it while also increasing the percentage of balls hit to the part of the park most likely to slow him down.
Now, granted, the closer you get to Pesky’s Pole, the easier it gets to poke one out. But only one of his sixteen home runs this year have been right down the line. And while J.D. Martinez is known for his opposite field power, he has been obliterating the ball the other way this season. That’s an excellent sign for Red Sox fans.
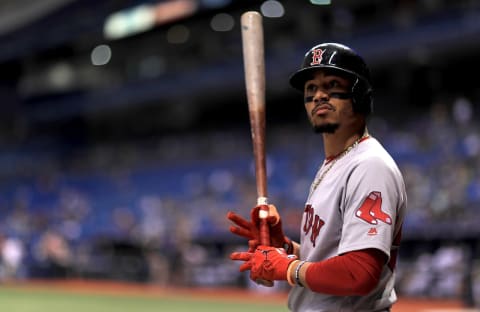
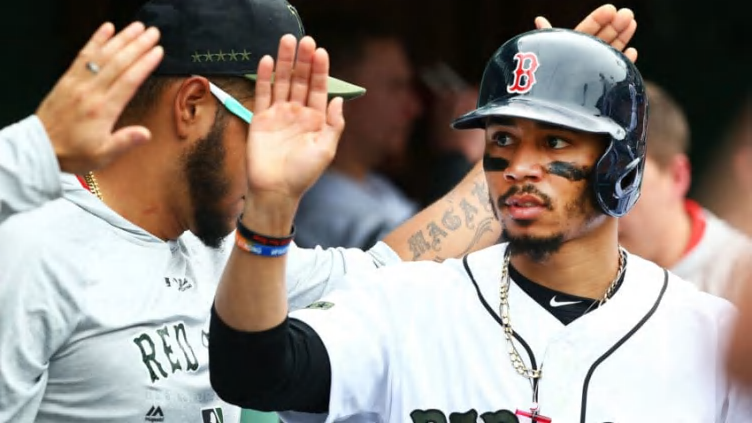
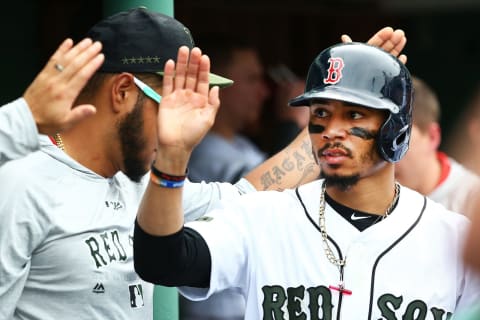
1. Statcast: Mookie Betts, OF – Boston Red Sox (14.9 Brls/PA)
- AVG – .361 (1st)
- OBP – .438 (2nd)
- SLG – .761 (1st)
- HR – 17 (1st)
- RBI – 37 (7th)
- wRC+ – 215 (1st)
- wOBA – .494 (1st)
- xwOBA – .519 (1st)
And finally, we come to the guy who loves to stick my foot in my mouth, Mookie Betts. The Mookie versus Mike Trout talk has always been a little silly, and for their careers it still is. That said, Mookie Betts appears to be determined to make it less so. He leads the majors in Brls/PA, HR, total bases, balls hit in that most-productive-in-baseball 19 to 26-degree range, and virtually everything else. He’s the best player in the game right now, and there are no signs that that’s about to change.
His .340 BABIP is a touch higher than his .327 xBABIP, but his xBACON (batting average on contact) is a whopping .404. He also leads the majors in Value Hits at 17.4%. I’ll let Andrew Perpetua of xStats explain that metric:
“Value Hits are the highest quality batted balls in the game. They register as extra base hits 81% of the time, and account for 85% of all home runs, 43% of doubles, and 37% of triples. On the main stats sheets you will see the stat expressed as VH%, which measures Value Hits per Plate Appearance.”
In layman’s terms: He’s hitting the snot out of the ball.
What’s driving his success?
We’ve taken a look under the hood with Mookie Betts a couple of times this season. So we don’t need to go into too much detail here. In one of our earlier looks, we pointed out that his fly ball range (balls hit between 26 and 39 degrees) had dropped in 2017 and came back up again this season.
Well, it’s now the lowest it’s been in the last three seasons at 8.2%. Of course, he’s got that 25.2% HD range (19 to 26 degrees), more than double his 2016 or 2017 rate.
And then there’s the LD range (10 to 19 degrees). It’s up more than 2% from last season. Most of the gains in the LD and HD ranges came from GB (0 to 10 degrees), which means he’s taking the infield out of the equation. Just 12% of his balls in play end up in that range, the 16th lowest rate in baseball. He’s getting the ball into the air as well anyone, but he’s keeping it in a productive range while doing it.
There isn’t a better hitter on the planet through the first third of the season. If Mookie Betts is ever going to beat Mike Trout out for an MVP, this might be the year.
What conclusions can we draw from Statcast?
The simplest is that if you appear at the top of the league in Brls/PA, you are probably an outstanding hitter. And those that aren’t but show up anyway seem to be driven by abnormalities. See Joey Gallo and the three true outcomes, or Teoscar Hernandez and the oddly isolated HD range of balls in play keeping him afloat.
It would seem that there isn’t one right predictive metric for guessing at where a batter will fall on this list. Does that mean that Brls/PA isn’t a good predictor of success? I wouldn’t go that far. Eight of our ten hitters are excellent at the plate. And the names that follow them in the rankings for Brls/PA aren’t precisely roster filler.
The next 10 on the list.
Bryce Harper, Giancarlo Stanton, Matt Kemp, Yonder Alonso, Salvador Perez, Aaron Judge, George Springer, Khris Davis, Adam Duvall, and Jose Abreu fill in 11-20. This might be a bit too “nail on the head” but what it comes down to is if you lift the ball and hit it hard, good things will happen.
And while the “launch angle revolution” is often misconstrued as just increasing launch angle regardless of context, it’s more about optimizing launch angle. That’s what most of our top ten here have been doing, and it’s paying dividends.
Having a lot of Brls/PA might not guarantee that a player is one of the top hitters in the game. But if their results are among the best and their Brls/PA are as well, there’s a pretty good chance those results reflect genuine talent.
Think about it like DIPS theory. When a pitcher with a great ERA also has a great, SEIRA, FIP or xFIP, you can feel pretty confident that the ERA isn’t about to balloon. We’re in a golden age for information about the game.
Next: Tony Gwynn: Mr. Padre’s legend and legacy
That means we get to keep checking in on these metrics to see how they are holding up over larger sample sizes. Will the top 10 today be similar to the top 10 in August? We’ll see soon enough.
In the meantime, what do you think? Are these the top 10 hitters in the game? If not, who is your 10 best?