MLB attendance: The final decline numbers for 2018

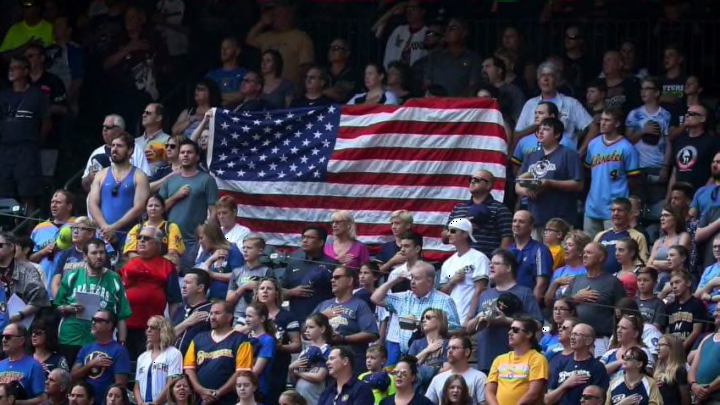
MILWAUKEE, WI - JUNE 24: Fans display an American flag during the singing of the national anthem before the game between the Milwaukee Brewers and St. Louis Cardinals at Miller Park on June 24, 2018 in Milwaukee, Wisconsin. (Photo by Dylan Buell/Getty Images)
3 of 3
Next
BOSTON – APRIL 13: TJ Gonick, 3, of Nutley, NH, is first through the turnstiles during the Red Sox home opener at Fenway Park in Boston on April 13, 2015. (Photo by Jessica Rinaldi/The Boston Globe via Getty Images)
BOSTON – APRIL 13: TJ Gonick, 3, of Nutley, NH, is first through the turnstiles during the Red Sox home opener at Fenway Park in Boston on April 13, 2015. (Photo by Jessica Rinaldi/The Boston Globe via Getty Images) /

We’ve looked twice at MLB attendance this season. So how did things finish up for MLB at the turnstiles?

MLB attendance didn’t look so hot three-quarters of the way through May – only eleven teams were ahead of their 2017 paces in attendance. Halfway through July there were nine teams whose attendance was better than last season. Yikes!

After the wondrous warmth of summer and the excitement of pennant races producing not one, but two playoff games for division titles, surely that’s improved. Two extra games couldn’t have hurt MLB attendance.

At season’s end 13 teams posted an increase in attendance. The full list is, alphabetically by city or state, the Diamondbacks, Braves, Rockies, Astros, Angels, Dodgers, Brewers, Yankees, Athletics, Phillies, Padres, Mariners, and Nationals. The Astros attendance grew the most, by over half a million. Put another way, however, 56.7 percent of MLB teams dropped in attendance.

But that 13 would suggest the warmer weather helped a bit, right? Not so fast, Bunky. Even a casual glance at the Oct. 1 attendance chart produces an instant pause.

First, there are the Angels and Nationals lines. Washington attracted 57 more people per game than in 2017 in a failed push to win their division championship and, thus, make the playoffs. The American League team “assigned” to Los Angeles attracted eight more per game. In all 631 more tickets were sold to people interested in seeing Mike Trout at home than were sold last year. The team closest to the flat attendance line but with a decline, the White Sox, hosted 255 fewer people per game than last year, or at least sold them tickets. These three teams could be called “effectively flat,” thus leaving 11 teams in the black and 16 in the red for attendance (or at least 256 tickets away from “absolutely flat”).

The Red Sox were the next closest to absolutely flat (at minus-273 per game), but they are constrained by a small venue that sells out almost all the time. They’re “always” going to be close to the year-over-year break-even line.

All in all, MLB attendance dropped for the sixth straight year in terms of tickets sold. This season’s total was 69,671,272, the first figure below 70 million since 2003.

KANSAS CITY, MO – APRIL 3: Bob Danley walks through the turnstile as he enters Kauffman Stadium for a game between the New York Mets and Kansas City Royals on April 3, 2016 in Kansas City, Missouri. (Photo by Ed Zurga/Getty Images)
KANSAS CITY, MO – APRIL 3: Bob Danley walks through the turnstile as he enters Kauffman Stadium for a game between the New York Mets and Kansas City Royals on April 3, 2016 in Kansas City, Missouri. (Photo by Ed Zurga/Getty Images) /

MLB Attendance: A Little History

Let’s back up, however. The creation of the Florida Marlins and Colorado Rockies in 1993 produced the largest jump in MLB attendance in the past 30 years, from roughly 55.8 to 70.2 million. Florida and Colorado alone accounted for about 7.5 million of those new tickets sold, and the eventual World Series opponents, the Blue Jays and Phillies sold another 7.1 million.

Following that, an anticipated increase in attendance related to the creation of Wild Cards was undercut by the MLB strike of 1994, and MLB attendance didn’t reach 70 million again until 1998. Since then, however, that 70 million figure has held for all but three years, 2018 now among them. This has occurred despite games being played in newer parks in several cities that are considerably smaller than the old concrete bowls in Philadelphia, Pittsburgh, and St. Louis, for example.

These newer parks are much nicer places to be, but an eye test regarding attendance in them tells us something to remember about MLB attendance. Attendance figures represent tickets sold.

A great number of MLB tickets are not being used or at least not used for full games, which is fairly astonishing considering their prices. How many is hard to quantify because people who aren’t in their purchased seats at MLB ballparks may be involved in modern “distraction features” somewhere else in those parks. Citizens Bank Park in Philadelphia, for example, now features a wiffle ball “park” for kids to play in as well as a climbing wall, to name only two distractions. Of course, some ticket holders may be at home, too.

However, ask yourself how many times you’ve heard remarks in bars, game rooms, and living rooms about baseball attendance like this one recently overheard in a bar with an MLB game on TV: “Look at this, there’s 14 people there.” The reply was: “If that.”

MLB has a growing attendance problem it can’t even count properly.

DENVER, CO – APRIL 26: Gerardo Parra #8 of the Colorado Rockies takes an at bat in front of empty stands as catcher Francisco Cervelli #29 of the Pittsburgh Pirates backs up the plate and umpire Dale Scott oversees the action at Coors Field on April 26, 2016 in Denver, Colorado. The Pirates defeated Rockies 9-4. (Photo by Doug Pensinger/Getty Images)
DENVER, CO – APRIL 26: Gerardo Parra #8 of the Colorado Rockies takes an at bat in front of empty stands as catcher Francisco Cervelli #29 of the Pittsburgh Pirates backs up the plate and umpire Dale Scott oversees the action at Coors Field on April 26, 2016 in Denver, Colorado. The Pirates defeated Rockies 9-4. (Photo by Doug Pensinger/Getty Images) /

MLB Attendance: So, What’s Wrong?

At the beginning of 2018, part of the MLB attendance drop was attributed to bad weather. By the end of May, major league teams were on a pace to drop by over 4.9 million tickets from 2017 (at a pace of minus-2021 per game), which would have been nearly as large a decline as that in 2009, when almost 5.2 million tickets were lost year-over-year. So the warm weather did help MLB attendance, and the drop ended up being under 3.1 million, but was still the worst drop in nine years.

What’s actually wrong isn’t the weather; cold Aprils have been a feature of the Northeast and upper Midwest for hundreds of years. The real problems seem to fall into two categories: cost and modern game realities.

Cost
As with the costs of most of life’s necessities and pleasure purchases, the cost of seeing an MLB game is a function of this particular time. For many people, part of the cost of seeing a game is hidden in basic or near-basic cable or direct-signal TV packages and, therefore, perceived as “free.” In other words, what sports fan doesn’t have a TV? It’s like toilet paper or soap, a must-have. Going to the ol’ ballpark is another story.

In many markets, two decent tickets to an MLB ballgame end up basically turning into a minimum $200 experience. “Decent” is considered here to be nearly close enough to see things you see just as well on TV, but from a different, constant angle. The tickets, with fees, will be $50-70 apiece; parking will be $15-$25 (public transportation a bit less). Two beers and a sandwich apiece will be in the neighborhood of $50-60, and two modest souvenirs another $50. (Two ultra-modest souvenirs could drop into the $20 neighborhood.) If the non-driving ticket holder wants a third beer, $300 will come into sight.

Therefore, people stay home and watch their MLB teams on TV.

Modern Game Realities (MGR)
Every fan now seems to have a pet peeve about baseball as it’s played in 2018, and some will tell you specific realities actually keep them away from ballparks. Some of these are specific to certain teams. Maybe the Hometown Nine is “cheap,” or “always loses,” or “trades away our stars,” and that’s enough of a turn-off, but more often than not the complaint is generalized to all teams and how the game is now played.

Professional observers have theories about this too. For example, Philly.com’s David Murphy recently wrote in regard to MLB attendance: “This season, teams are using an average of 4.25 pitchers per game, the most in baseball history and a significant increase over where things stood even 10 years ago (3.92).” Later in the piece presenting these figures Murphy suggested: “There is no reason baseball couldn’t institute a rule that requires a pitcher to face at least three batters once he takes the mound.”

Let the debate about the importance of match-ups begin, but too many pitchers is Modern Game Reality No. 1, and they probably do keep some people away from the park. No one comes to the park to see pitchers warm up.

Of course, MGR No. 1 is directly related to MGR No. 2, too many pitches seen. Everybody in MLB is now trying to walk, even hitters without particularly good plate judgment (who might benefit from hunting more early fastballs). The result of this is an ever-rising pitch count, which this year reached 3.90 per plate appearance, the highest figure since this has been counted (since 1999 by Baseball-Reference.com).

Moreover, in the 20 years this statistic has been calculated, there have been only four drops in the figure, which was 3.74 pitches in ’99. Those drops were minus-.03 twice, minus-.02 and minus-.01 once apiece. The largest jumps in the figure were plus-.04 between 2007 and ’08, and plus-.05 between 2015 and ’16. Excluding the small drops noted, this tendency has gone straight uphill, however.

Game length is MGR. No. 3, and pretty obviously related to the two matters above. This figure has bounced around a little more than pitches per plate appearance, but the average game time first went over three hours in 2014 and has dropped below three hours only once since then (2:56 in 2015). Some people blame game length for driving patrons away, but it may well be that the game time itself isn’t the problem for all those folks so much as is watching batters taking pitches and pitchers being changed for the 34 more minutes added to the average game in the past 40 years.

The first of two Games 163 played recently, the Brewers’ defeat of the Cubs, took 3:06 to play, and 12 pitchers were used. Only three batters walked, however, all members of the losing Cubs.

Finally, defensive shifts (MGR No. 4) are often loudly and vehemently denounced as negatively affecting MLB attendance, probably first and foremost because they take away hits if deployed intelligently, and therefore, help restrict scoring. No one goes to the ballpark to see a ground ball slowing down in the outfield grass, being fielded by a second baseman effectively playing short fielder, and the batter who hit that ball being thrown out.

Of the five problems above, only the last seems a matter players are going to have to solve on their own – by learning to hit the other way, for the most part. All of the other matters are susceptible to some tinkering.

For example, once a game starts, or after the first half-inning, why not sell any remaining unsold seats to walk-up fans for $10, and for $5 to kids under a designated age? If you don’t like mandating a pitcher face three batters, how about two batters? Do you like either of those ideas better if that mandate is restricted to the first seven innings?

Next. ESPN alternate broadcast popular with fans. dark

Tell us what you think, however, in Comments. What was missed here? How is any of it fixed?
Next