

Miami Marlins: The franchise all-time bracket

The Miami Marlins have only had two truly strong teams, and both won the World Series. Which will prove to have been the franchise’s best?
Since the creation of the Marlins in 1993, the franchise has lived a curious, often difficult existence.
No Miami Marlins team has ever won a division title, yet the Marlins have two World Series trophies. Both came as wild cards, in 1997 and again in 2003.
More from Call to the Pen
- Philadelphia Phillies, ready for a stretch run, bomb St. Louis Cardinals
- Philadelphia Phillies: The 4 players on the franchise’s Mount Rushmore
- Boston Red Sox fans should be upset over Mookie Betts’ comment
- Analyzing the Boston Red Sox trade for Dave Henderson and Spike Owen
- 2023 MLB postseason likely to have a strange look without Yankees, Red Sox, Cardinals
They are also the only two Marlins teams to have played a post-season game. In fact, only six Marlins teams in history have finished the regular season with better than .500 records, so our eight-team bracket will include two sub-.500 teams.
Begin with the two champions, the 1997 and 2003 clubs. To them, the obvious decision is to add the four teams that won more games than they lost. Those would be the teams of 2004, 2005, 2008 and 2009.
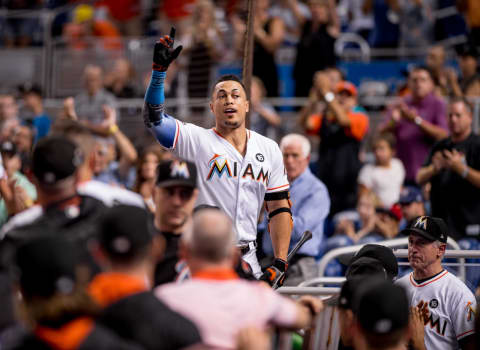
Of the other Marlins teams, those that came closest to .500 were the 1996 and 2010 teams, both of which were 80-82. But there is also an irresistible quality to the 2017 Marlins. True, that team only finished 77-85, but it featured (and subsequently traded away) a darned good outfield: Giancarlo Stanton, Marcel Ozuna, and Christian Yelich, all of them at or approaching their primes.
Given the mediocre nature of the 2010 club, it seems a reasonable thing to drop it in favor of 2017.
More. MIA: Yasiel Puig confirms 'Fish' made him an offer. light
The format is largely identical to previous bracket challenges, but there is one adaptation made in deference to the franchise’s youth. In fact, none of the eight teams in this bracket has produced a Hall of Famer, so in cases when a Game 7 is required we are substituting All-Star selections.
Otherwise, each matchup in the tournament is decided based on seven criteria. You can think of each as a ‘game,’ the winner of four games advancing. The seven criteria are:
- Game 1: Regular season winning percentage.
- Game 2: Post-season winning percentage
- Game 3: Team OPS+
- Game 4: Team ERA+
- Game 5 (if necessary): Team WAR
- Game 6 (if necessary: Fielding percentage above the league average for the season in question.
- Game 7 (if necessary): The standard for Game 7 is Hall of Famers or likely future Hall of Famers.
Miami Marlins: The All-Time Bracket
No. 1 vs. 8 seed
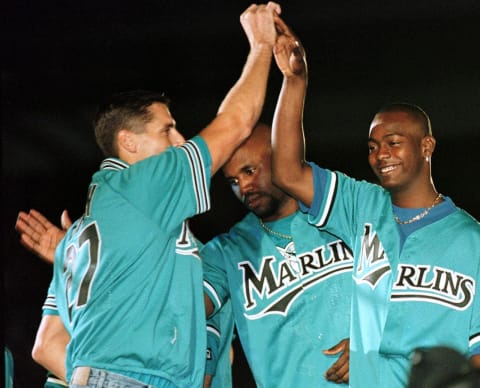
The 1997 World Series winners deserve the top seed if only because their regular season record was one game better than their 2003 counterparts. In fact, it’s the best in franchise history.
That club featured a highly paid roster of players who for the most part were on the down side, but who had one or two good seasons remaining. Moises Alou drove in 115 runs, Bobby Bonilla added 96 and catcher Charles Johnson was a franchise fixture. Gary Sheffield batted only .250, but he did hit 21 home runs.
The team’s strength was its pitching. Kevin Brown was 16-8 with a 2.69 ERA, while Livan Hernandez, Alex Fernandez, and Al Leiter all put together quality seasons. Robb Nen closed out 35 games.
Now about the 2017 team. As indicated by its record, that Marlins club had no depth. But Ozuna batted .312 with 37 homers and 124 RBIs, Stanton reached 59 homers with 132 RBIs, and Yelich drove in another 81. Second baseman Dee Gordon hit. 308.
Coming off the previous September’s death of ace Jose Fernandez, the mound staff lacked a star, depth, and direction. Jose Urena emerged to win 14 of his 22 decisions, but the Marlins only had one other pitcher with more than eight victories.
Related Story. Tampa Bay Rays: The franchise all-time bracket. light
Game 1: The 1997 team’s .568 percentage obviously trumps 2017’s .475.
Game 2: The 1997 World Series winners had a .688 post-season percentage. The 2017 team did not play a post-season game.
Game 3: If 2017 is to get back in the series, it must happen on OPS+. The Stanton-Yelich-Ozuna team had a 107 OPS+ score. The 1997 champions weren’t great offensively, managing only a 98.
Game 4: The 1997 Marlins of Brown, Hernandez, and Leiter compiled a 106 staff ERA+. Without Fernandez, the 2017 staff wandered to an 83 ERA+.
Game 5: The 2017 team produced a 27.4 E=WAR. In m1997 the Marlins won with a 37.4 WAR.
Result: 1997 in five games
Miami Marlins: The All-Time Bracket
No. 4 vs. 5 seed
Much of the rest of this bracket will focus on pretty ordinary teams, beginning with the 2008 club. It did finish seven games above .500, but that was only good for third place in the NL East, seven and one-half games behind the Philadelphia Phillies and six out of the wild card.
The middle infield, second baseman Dan Uggla and shortstop Hanley Ramirez, starred. Uggla hit 32 homers and drove in 92 runs, while Ramirez batted .301 with 33 homers. First baseman Mike Jacobs also hit 32 home runs.
Ricky Nolasco enjoyed the best season of his career, a 15-8 record and 3.52 ERA in 32 starts. Elsewhere, though, the pitching wasn’t much, Closer Kevin Gregg scavenged 29 saves.
The 2004 Marlins also came home third, 13 games behind the Atlanta Braves and nine games out of the wild card chase. Second-year outfielder Miguel Cabrera blossomed as a superstar, batting .294 with 33 homers and 112 RBIs.
Third baseman Mike Lowell provided support with a .294 average, 27 homers and 85 RBIs. Center fielder Juan Pierre stole 45 bases.
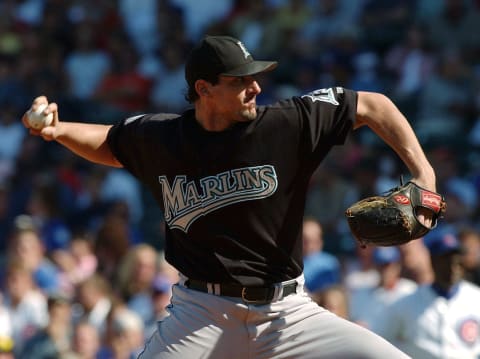
Carl Pavano won 18 games, but Josh Beckett and Brad Penny both faded off the highs they experienced during the 2003 championship runs. In 26 starts, Beckett managed only a 9-9 record and 3.79 ERA Penny was 8-8 in 21 starts.
Related Story. Baltimore Orioles: The franchise all-time bracket. light
Game 1: The 2008 team finished 84-77, a .522 percentage. The 2004 team was 83-79, .512.
Game 2: Neither team played a post-season game; hence this is a double forfeit.
Game 3: The 2008 club had a 97 OPS+. That doesn’t sound like much, but it’s enough to beat the 2004 team’s 94 OPS+ and take a 2-0 series edge.
Game 4: In 2004 the Marlins had a 101 staff ERA+. The 2008 staff only got to 98.
Game 5: The 2004 club evens the series with a 30.3 team WAR. The 2008 team only produced a 28.4 WAR,
Game 6: In 2008 the Marlins fielded .980, four points below the National League average. The 2004 Marlins fielded .986, and that was three points better than the league average. The 2008 team’s series lead is now 3-2 with one tie.
Game 7: The 2004 Marlins produced four All-Stars: pitchers Armando Benitez and Carl Pavano as well as Lowell and Cabrera. The 2008 team only featured two: Ramirez and Uggla. We have an unusual deadlock through seven games.
Game 8: To find a suitable series tie-breaker we are forced to fall back on an obscure team measurement, team fielding wins above average. It is just what it sounds like: a position-by-position analysis of how much each team helped itself in the field compared with its opponents. In 2008 the Marlins totaled -1.4 fielding wins above average. The 2004 team totaled +0.5 fielding wins above average.
Result: 2004 in eight games, one tie
Miami Marlins: The All-Time Bracket
No. 2 vs. 7 seed
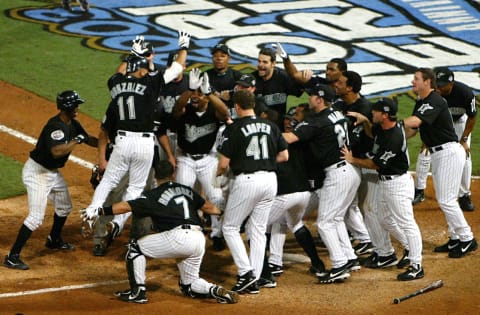
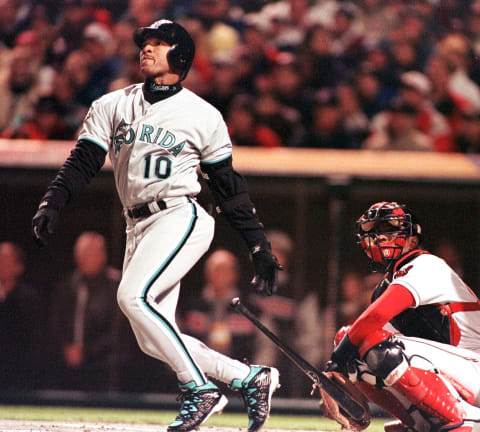
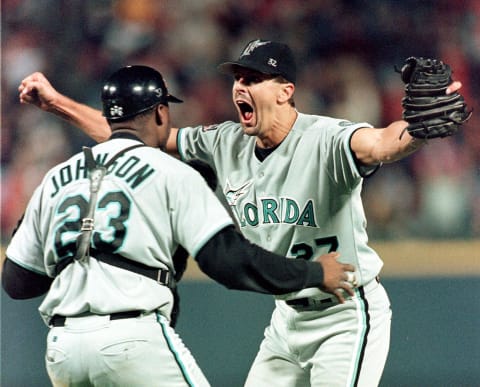
The 2003 Miami Marlins finished 10 games behind the Atlanta Braves in the NL East, but they also benefitted when the Chicago Cubs took out the Braves in the division round as Florida ousted San Francisco. They ensuing NLCS and the World Series with New York have been written about enough that they do not need to be elaborated on here.
Pierre batted .305 for that Marlins team with 65 steals. Lowell drove in 105 runs with 32 homers, and first baseman Derrek Lee had 31 home runs, 92 RBIs.
The pitching was ordinary, Penny and Mar Redman each winning 14 games. Beckett was limited to 23 regular season starts but became a force in the post-season.
The 1996 Marlins made a brave run at the franchise’s first .500 record. In fact, they were even with two games remaining, losing both to Houston, the coup de grace being delivered by Tony Eusebio’s walk-off double in game 162.
Shortstop Edgar Renteria batted .309 and Sheffield led the team at .314. He also hit 42 home runs and drove in 120 runs.
Brown won 17 with a 1.89 ERA and Leiter 16 with a 2.93 ERA, but the rest of the staff was mediocre.
light. Related Story. Atlanta Braves: The definitive franchise all-time bracket
Game 1: The 2003 team’s .562 percentage is clearly superior to 1996’s .494.
Game 2: A walkover for the 2003 Marlins.
Game 3: In 2003 Florida had a 97 team OPS+. The 1996 club only got to 93…another win for 2003.
Game 4: This series is a sweep. The 2003 Marlins had a 105 staff ERA+, two points better than 1996’s 103.
Result: 2003 in four games
Miami Marlins: The All-Time Bracket
No. 3 vs. 6 seed
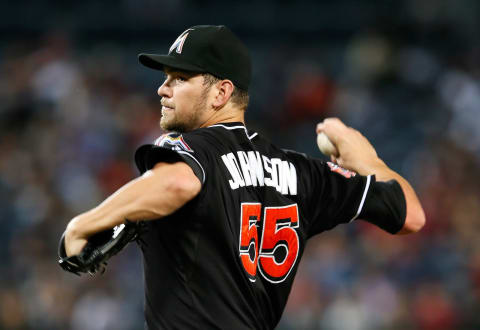
The 2009 Miami Marlins finished second in the NL East, six games behind the Phillies and five out of the wild card. Ramirez batted .342 with 24 homers and 106 RBIs, while first baseman Jorge Cantu drove in 100 runs.
On the mound Josh Johnson started 33 times, winning 15 against just five losses. He also had a 3.23 ERA. But the pitching depth was not present: Nolasco had a 5.06 ERA and Anibal Sanchez won just four of 12 decisions.
In 2005 the Marlins were 83-79, seven games behind the Braves and six behind the wild card Astros. Cabrera batted .323 with 33 home runs and 116 RBIs, and first baseman Carlos Delgado added 33 homers with 115 RBIs on a .301 average.
This was Dontrelle Willis’ big season. Willis was 22-10 with a 2.63 ERA in 34 starts. Beckett rebounded for a 15-8 record and 3.38 ERA. Todd Jones picked up 40 saves.
New York Mets: The definitive franchise all-time bracket. light. Related Story
Game 1: The 2009 team had the better of it in the regular season by four games, 87-75 .537 to 83-79 .512.
Game 2: Double forfeit
Game 3: The 2005 Marlins produced a 101 OPS+, four points better than 2009’s 97.
Game 4: In 2009 Marlins pitchers compiled a 100 staff ERA+. The 2005 Marlins only got to 96. The 2009 team takes a 2-1 series lead.
Game 5: the 2009 Marlins had 32.3 WAR, one point better than 2005’s 31.2.
Game 6: The 2009 Marlins fielded .982, two points worse than the league average. The 2005 team fielded .983, level with the league average. The series now stands 3-2 in favor of 2009.
Game 7: Ramirez and pitcher Johnson were the two Marlins All-Star representatives. In 2005, Cabrera, Willis, catcher Paul LoDuca, and infielder Luis Castillo all made the team. We find ourselves in need of yet another game 8.
Game 8: In 2005 Marlins fielders produced 1.0 wins above average. The 2009 Marlins got to 1.7 on that standard.
Result: 2009 in eight games, one tie
Miami Marlins: The All-Time Bracket
Semi-finals
Not surprisingly, the 1997 and 2003 teams reach the semi-finals as strong favorites to their 2004 and 2009 challengers.
1997 vs. 2004
Game 1: This is a virtual walkover for 1997 given its .568 regular-season percentage. The 2004 team only got to .512.
Game 2: This is a literal walkover for 1997 since the 2004 team did not play a post-season game.
Game 3: In 1997 the Marlins had a 98 OPS+. The 2004 team, however, only reached 94.
Game 4: It’s a quick sweep for 1997, whose 106 ERA+ beats the 2004 team’s 101 by five points.
light. Related Story. San Diego Padres: The franchise all-time bracket
2003 vs. 2009
Game 1: The 200e Marlins won at a .562 rate. The 2009 team had a .537 percentage.
Game 2: Another walkover for 2003.
Game 3: The 2009 Marlins compiled a 97 OPS+. In 2003 the champions also had a 97 OPS+. This game goes to a tie-breaker, best individual OPS+ among regulars. That belonged to Lee in 2003 at 131 and to Ramirez in 2009 at 148.
Game 4: The 2009 Marlins seek to even the series with their 100 staff ERA+. But the 2003 team counters with a 105 ERA+ to take a 3-1 lead.
Game 5: The 2009 Marlins accumulated 32.3 WAR. The 2003 team had 38.0 WAR.
Result: 2003 in five games
Championship
This tournament comes down to the franchise’s two World Series winners.
More from Miami Marlins
- The Miami Marlins actually do have a Jazz Chisholm problem
- Square one at catcher? Miami Marlins sign former backstop Jorge Alfaro
- Miami Marlins remake their infield at MLB trade deadline for playoff push
- Miami Marlins make late night splash with David Robertson trade
- MLB trade deadline: Nationals and Mets for sale, plus wish lists for Phillies, Braves, Marlins
Game 1: At 92-70, the 1997 team’s .568 regular-season percentage is exactly one game better than 2003’s 91-71 .562 percentage.
Game 2: The 2003 Marlins beat the Giants in four games, the Cubs in seven and the Yankees in five. That’s a .647 post-season percentage. The m1997 team swept the Giants and beat the Braves in six before defeating the Cleveland Indians in a seven-game World Series. That’s a .688 percentage and a victory in this game.
Game 3: The 2003 team had a 97 OPS+. In 1997 the Marlins managed one point better at 98. They take a commanding 3-0 series advantage.
Game 4: The 1997 Marlins had a 106 staff ERA+. In 2003 the Marlins reached 105, again just missing out.
Result: 1997 in four games
International Prospects: Javier Carrión, the next Yordan Álvarez?. dark. Next
This series may have been a sweep for the 1997 club, but it was a darned close one. They proved superior by margins of just six regular-season percentage points and 41 post-season percentage points. The latter, by the way, reflects one more post-season loss for the 2003 team. The 1997 club’s margin in both OPS+ and in ERA+ was also a single point.
The series would have been even closer than that because the 2003 team had advantages in both WAR and fielding averages. Both teams, for the record, produced three All-Stars.